


Author:Wall Street CN
summary
During the Spring Festival, most major overseas stock indices rose, and crude oil prices strengthened; negotiations between the US and Iran reached a stalemate, with the US issuing an ultimatum, and the US Supreme Court ruling that the reciprocal tariffs were illegal; domestic travel intensity during the Spring Festival holiday continued to rise, with both traditional and specialty tours seeing increased activity.
I. Global Asset Classes: Around the Spring Festival holiday, most overseas stock indices rose, and the RMB once appreciated to 6.88.
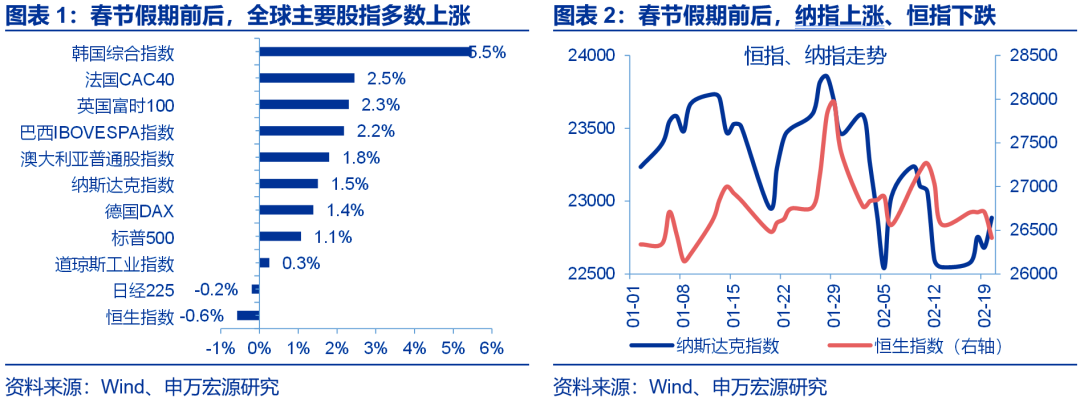
Around the Lunar New Year holiday (February 16-20), most overseas stock indices rose. In the US, boosted risk appetite by the Supreme Court's ruling that IEEPA tariffs were illegal, the Nasdaq, S&P 500, and Dow Jones rose 1.5%, 1.1%, and 0.3%, respectively. In Asian markets, the South Korean KOSPI surged 5.5%, while the Hang Seng Index fell 0.6%. In Europe, the CAC40, FTSE 100, and DAX 30 all rose.
Around the holiday, the US dollar index rebounded by 0.9%, and the offshore yuan rose to 6.88 at one point. The rebound in the US dollar index was mainly due to the widening interest rate differential between the US and Germany; during the holiday, due to the divergence in inflation trends, the 10-year US-Germany interest rate differential widened by 7 basis points. Benefiting from the "foreign exchange settlement wave," the offshore yuan continued its strong performance against the backdrop of a rapid rebound in the US dollar, and rose to 6.88 at one point.
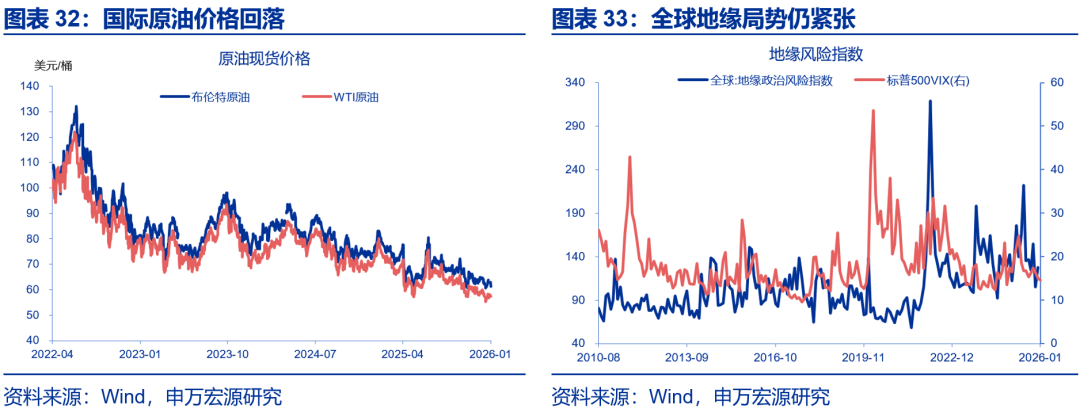
Around the holiday, oil prices continued to strengthen, while gold prices fluctuated upwards. In the crude oil market, boosted demand by the rejection of tariffs and escalating tensions with Iran, WTI crude and Brent crude surged 5.7% and 5.9% respectively to $66.5 and $71.8 per barrel. Although gold was pressured by a rebounding dollar, geopolitical safe-haven demand and stagflation expectations supported a strong rebound, with London gold rising 1.2% to $5053.2 per ounce.
II. Overseas Fundamentals & Data: United Statesreal GDP growthWeaker-than-expected, the US Supreme Court ruled that reciprocal tariffs were illegal.
US Q4 real GDP growth was weaker than expected, and Japan's January CPI fell to 1.5% year-on-year. US Q4 real GDP grew at an annualized rate of 1.4% quarter-on-quarter, weaker than the market expectation of 3%, largely due to the government shutdown; the Fed's January minutes highlighted divergent opinions; Japan's January CPI was 1.5% year-on-year, dragged down by energy and base effects; Japan's Q4 economic growth was weaker than expected, with an annualized rate of only 0.2% quarter-on-quarter.
The U.S. Supreme Court ruled that reciprocal tariffs were illegal. On February 20, the Supreme Court overturned Trump's "reciprocal tariffs" decision by a 6-3 vote. Trump immediately announced a 10% tariff increase globally based on Section 122, which was raised to 15% on February 21. In the short term, U.S. tariff rates may decrease slightly, but in the long term, the Supreme Court ruling is unlikely to change the overall tariff structure, and tariffs may remain in place for a long time.
US-Iran negotiations have stalled, with the US issuing an ultimatum. From February 17-18, the US and Iran held their second round of talks, reaching only a minor consensus on procedural guidelines, with significant differences remaining on core issues. On February 19, Trump stated that if a "meaningful agreement" could not be reached within 10-15 days, the US might take "further military action," potentially escalating geopolitical risks in the Middle East.
III. Domestic Events & Data: Travel intensity continued to rise during the Spring Festival holiday, with both traditional and specialty travel showing increased activity.
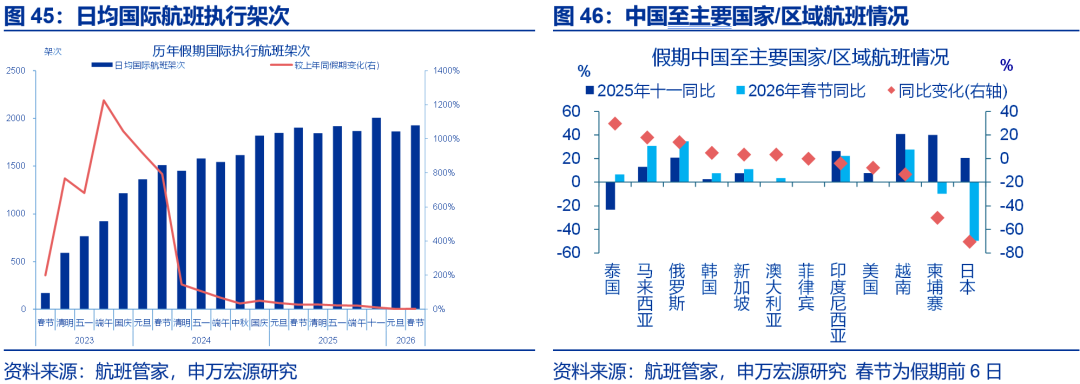
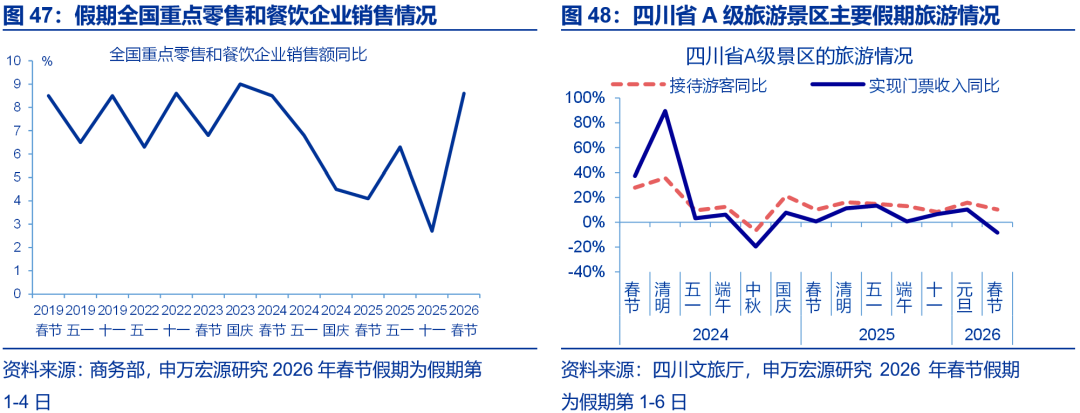
During the Spring Festival holiday, the intensity of travel continued to rise, and the popularity of domestic tourism rebounded. 1) The intensity of travel continued to rise, increasing year-on-year from -5% on the second day of the holiday to 12.3% on the sixth day; 2) In terms of flights, the number of domestic flights increased by 1 percentage point year-on-year to 3% compared to the National Day holiday, while the number of international flights decreased by 9.1 percentage points year-on-year to 1.3%; 3) Traditional scenic spots such as Sichuan scenic spots saw a rebound in tourism popularity, and characteristic tourism such as "intangible cultural heritage tourism" performed well.
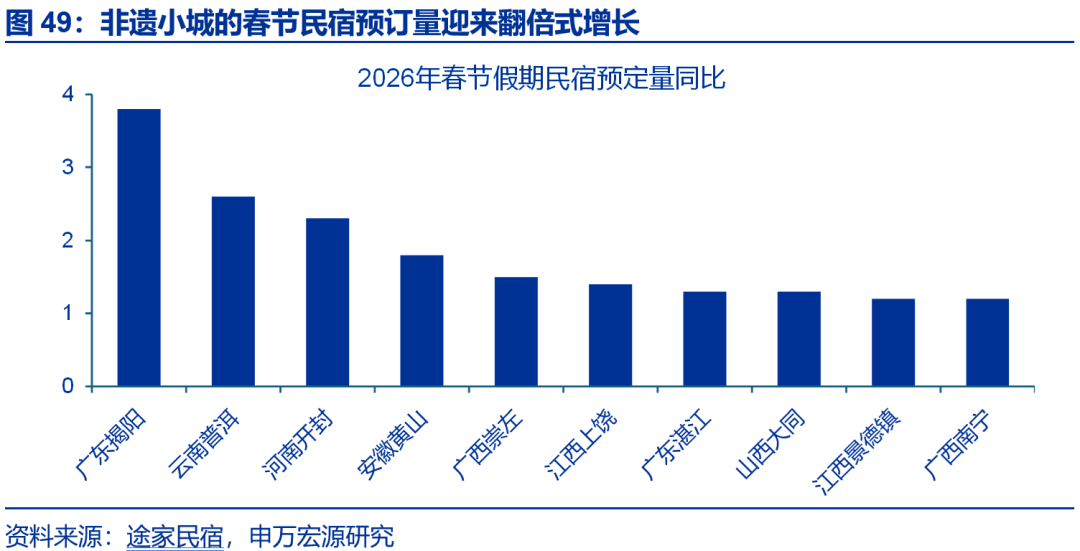
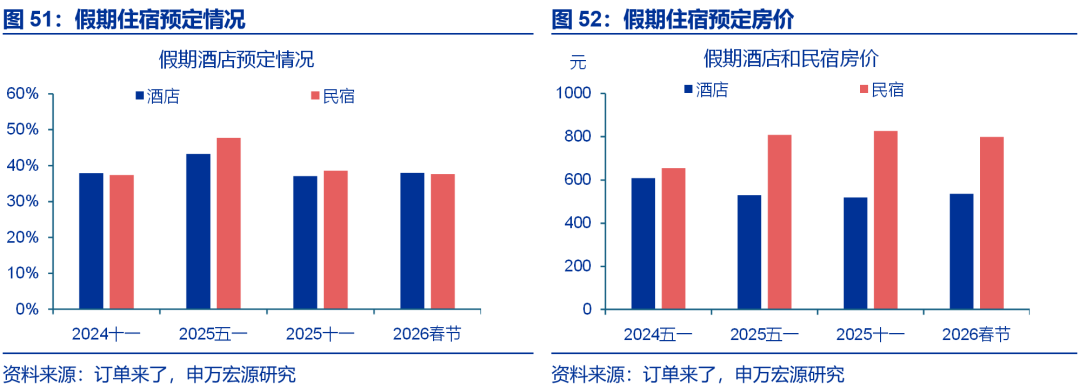
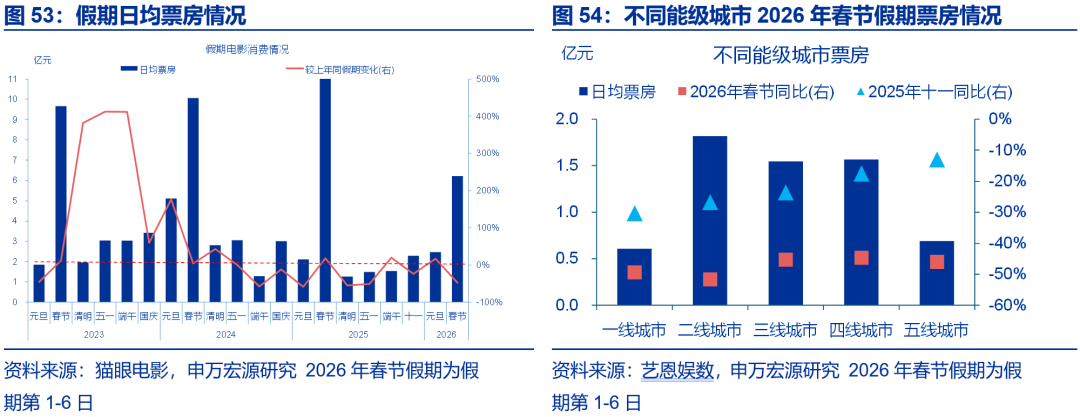
Overall prices remained stable, with hotel and airfare prices rising slightly, while movie ticket prices were relatively weak. 1) During the first four days of the holiday, sales of key retail and catering enterprises nationwide increased by 8.6% year-on-year, 5.9 percentage points higher than the National Day holiday in 2025; 2) The average pre-sale airfare during the Spring Festival travel rush was 908 yuan, higher than the same period last year; 3) Hotel booking prices increased by 5.4% year-on-year, while homestay prices remained the same as the same period last year; 4) The average movie ticket price decreased by 4.5% year-on-year, 12.7 percentage points lower than the National Day holiday.
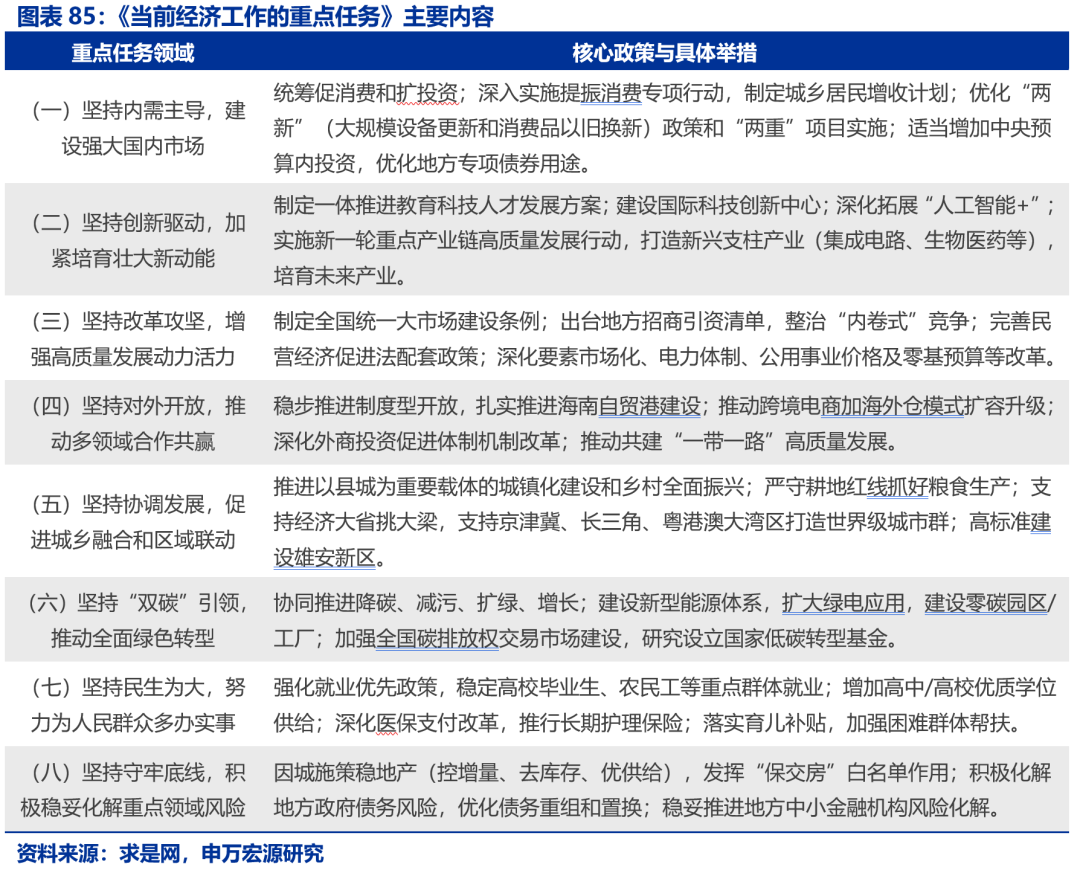
Before the holiday, Qiushi magazine published an important article by General Secretary Xi Jinping entitled "Key Tasks of Current Economic Work." The article clearly pointed out that the key tasks of current economic work are to precisely shift the focus of policy efforts to increasing the income of urban and rural residents and optimizing the "two new" policies, vigorously deepen and expand the layout of "artificial intelligence+" and strategic emerging industries, fully stimulate the vitality of various business entities, and promote the construction of a unified national market.
Risk Warning
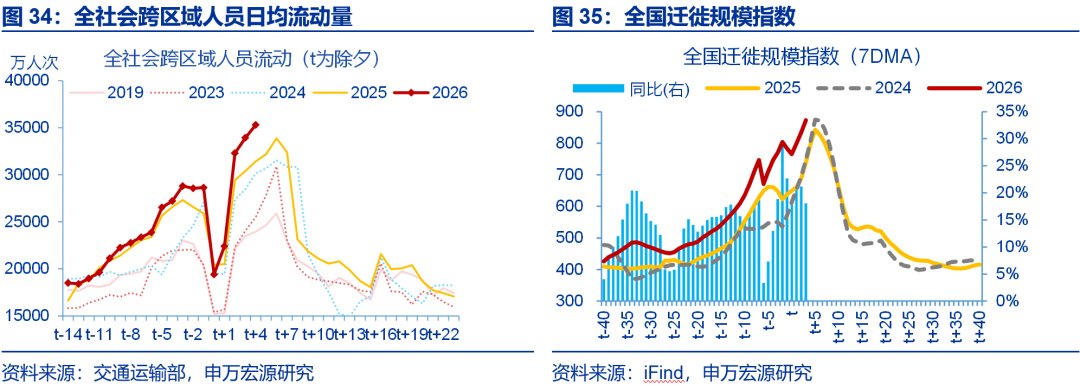
Geopolitical conflicts escalate; US economic slowdown exceeds expectations; Federal Reserve unexpectedly turns hawkish.
Report text
During the Spring Festival, most major overseas stock indices rose, and crude oil prices strengthened; negotiations between the US and Iran reached a stalemate, with the US issuing an ultimatum, and the US Supreme Court ruling that the reciprocal tariffs were illegal; domestic travel intensity during the Spring Festival holiday continued to rise, with both traditional and specialty tours seeing increased activity.
I. Global Asset Classes: Around the Spring Festival holiday, most overseas stock indices rose, and the RMB once appreciated to 6.88.
(i) Risk appetite improved in overseas markets, and most stock indices rose.
Around the Spring Festival holiday (February 16-20), most major overseas stock indices rose. In the US, boosted by the Supreme Court's ruling that IEEPA tariffs were illegal, the three major indices collectively rose, with the Nasdaq, S&P 500, and Dow Jones Industrial Average rising 1.5%, 1.1%, and 0.3%, respectively. In Asian markets, driven by the semiconductor sector, the South Korean KOSPI surged 5.5%, while the Nikkei 225 and Hang Seng Index fell 0.2% and 0.6%, respectively. In Europe, the French CAC40, the UK FTSE 100, and the German DAX rose 2.5%, 2.3%, and 1.4%, respectively.
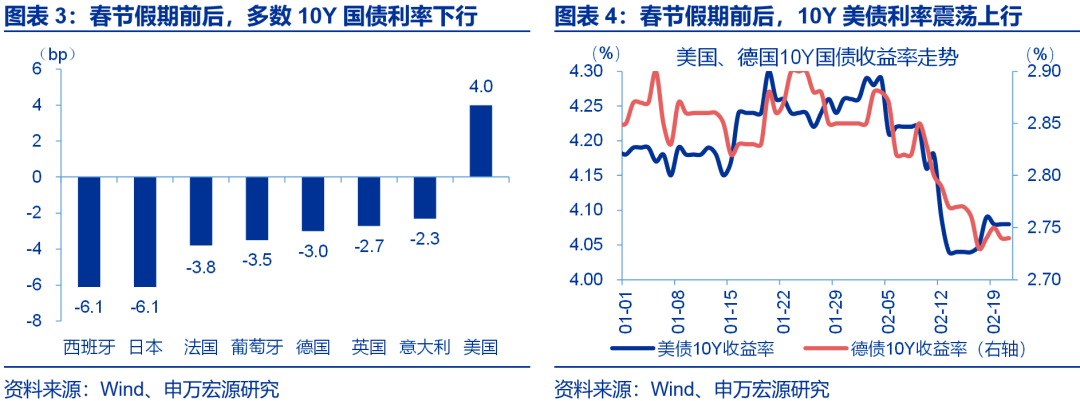
(ii) US Treasury yields rebounded slightly, while most European bond market yields fell.
Around the Spring Festival holiday (February 16-20), yields on long-term government bonds in most major developed countries declined. Influenced by relatively strong PCE data, the 10-year US Treasury yield rose 4.0 basis points to 4.08%. In other bond markets, influenced by declining inflation expectations, European bond yields collectively fell, with 10-year yields for Spain, Japan, France, Portugal, Germany, the UK, and Italy declining by 6.1 basis points, 6.1 basis points, 3.8 basis points, 3.5 basis points, 3.0 basis points, 2.7 basis points, and 2.3 basis points, respectively.
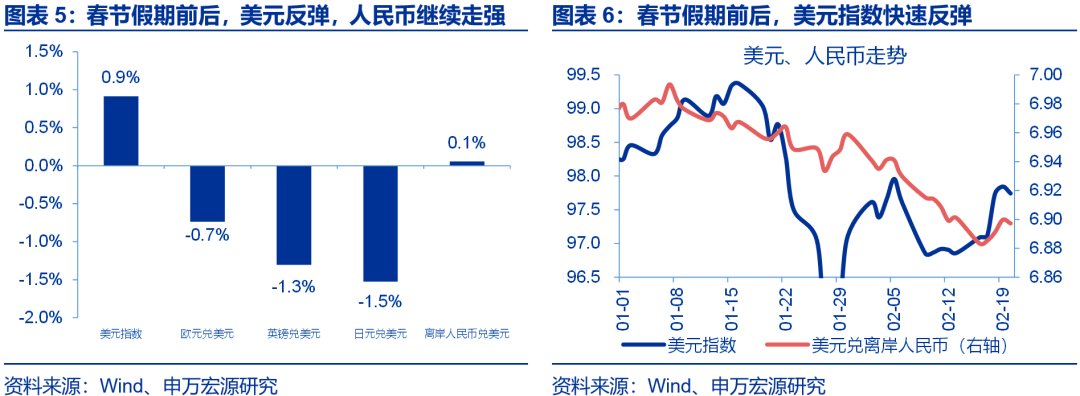
(III) The US dollar index rebounded rapidly, and the offshore RMB continued to strengthen.
Around the Spring Festival holiday (February 16-20), the US dollar index rebounded by 0.9%, and the offshore RMB rose to 6.88 at one point. The euro, pound sterling, and yen all depreciated against the US dollar, by 0.7%, 1.3%, and 1.5% respectively. The rebound in the US dollar index was mainly due to the widening interest rate differential between the US and Germany; during the holiday, due to the divergence in inflation trends, the 10-year US-Germany interest rate differential widened by 7 basis points. Benefiting from the "foreign exchange settlement wave," the offshore RMB continued its strong performance against the backdrop of a rapid rebound in the US dollar, rising to 6.88 at one point.
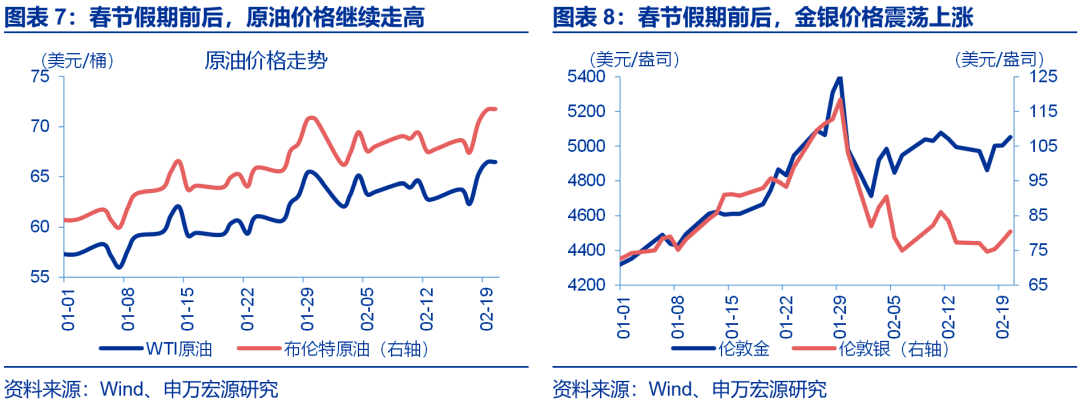
(iv) Crude oil prices continued to strengthen, while gold and silver prices fluctuated and rose.
Around the Spring Festival holiday (February 16-20), oil prices continued to strengthen, while gold prices fluctuated upwards. In the crude oil market, the US Supreme Court's rejection of the tariff bill boosted the prospects for global trade recovery. Coupled with renewed tensions in Iran raising concerns about supply disruptions, the combined positive factors on both the supply and demand sides propelled WTI crude oil and Brent crude oil prices up by 5.7% and 5.9% to $66.5/barrel and $71.8/barrel, respectively. In the gold market, although the rebound in the US dollar index and rising US Treasury yields exerted slight downward pressure on gold, safe-haven buying triggered by the Iranian geopolitical situation and stagflation hedging demand driven by weaker GDP and a rebounding PCE provided support. Gold prices fluctuated upwards amidst the tug-of-war between bulls and bears, with London gold rising 1.2% to $5053.2/ounce.
II. Overseas Fundamentals & Data: US economic growth weaker than expected; US Supreme Court rules reciprocal tariffs illegal.
(a) US GDP: Q4 real GDP growth was weaker than market expectations
US GDP growth in the fourth quarter was weaker than expected, but the full-year economic growth rate for 2025 is still projected at 2.2%. US real GDP grew by 1.4% quarter-on-quarter (annualized) in the fourth quarter of 2025, weaker than the market expectation of 3% and lower than the 4.4% in the third quarter. According to the Atlanta Fed's GDPNow forecast before the data release, the drag from the lower-than-expected data mainly came from government consumption and investment. However, overall, the US economic growth rate for the full year of 2025 is 2.2%, significantly stronger than the market expectations at the beginning of 2025.
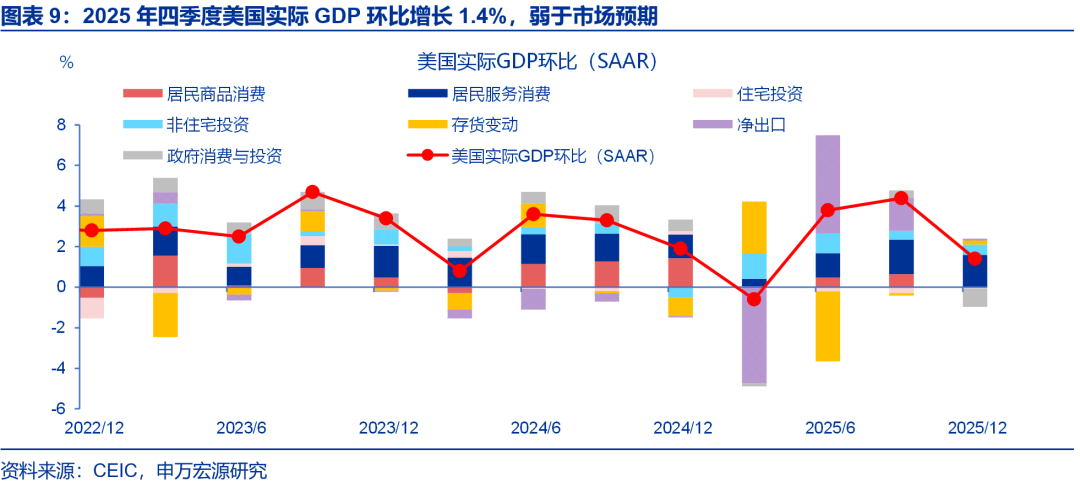
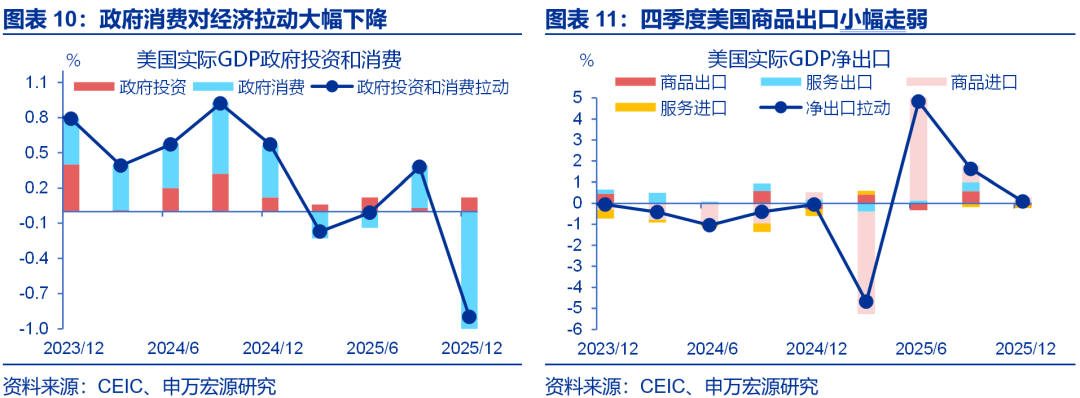
In the fourth quarter, the longest government shutdown in history led to a significant drag on economic growth due to government spending. The biggest drag on US GDP data in the fourth quarter came from the government sector, with government spending contributing 1 percentage point to real GDP growth (annualized quarter-on-quarter), compared to a 0.36 percentage point contribution in the third quarter. The government shutdown was the main contributing factor. However, this factor is temporary, and government spending is likely to rebound in the first quarter.
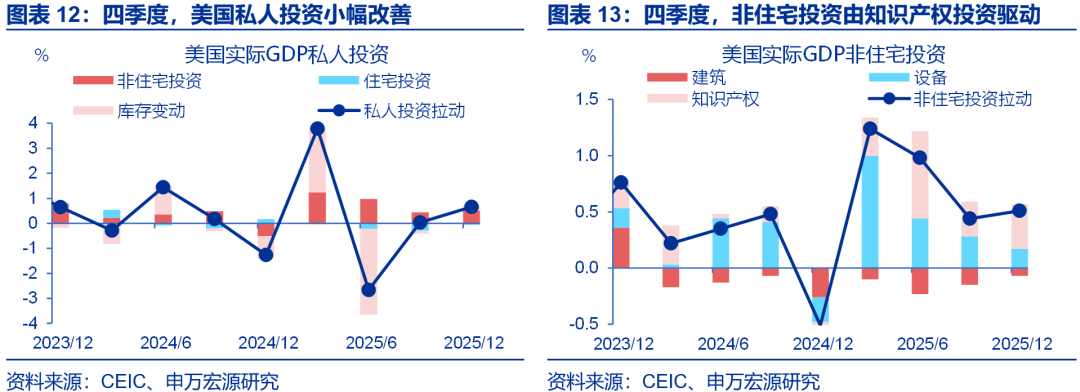
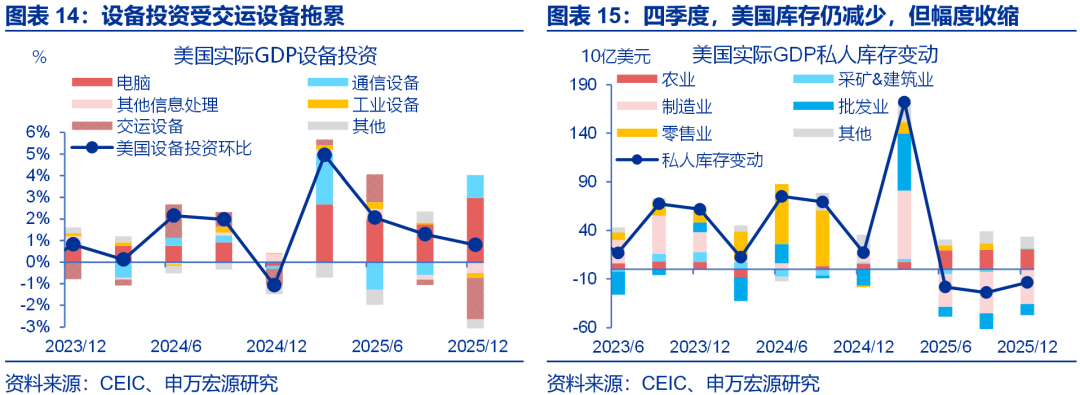
AI investment remained robust in the fourth quarter, while the decline in inventory narrowed, and residential investment showed marginal improvement. In the fourth quarter, US private investment contributed 0.66 percentage points to real GDP growth (annualized quarter-on-quarter), compared to 0.03 percentage points in the third quarter. The main driver was inventory changes, followed by residential investment. 1) Regarding residential investment, with the Fed's interest rate cuts and Trump's policies improving housing affordability, the US housing market may be in a "moderate" recovery phase in 2026; 2) In terms of non-residential investment, structurally, intellectual property investment increased, while equipment investment slowed, the latter being dragged down by transportation equipment, possibly related to weak auto consumption and tariff uncertainty. In other words, AI-related investment continued to support economic growth in the fourth quarter; 3) Regarding inventory, changes in US private inventory contributed 0.21 percentage points to economic growth in the fourth quarter, an increase of 0.33 percentage points compared to the third quarter, corresponding to a narrowing of the decline in US private inventory. As the inventory accumulated in the early stages of 2025 is depleted, the US inventory cycle is expected to shift towards replenishment.
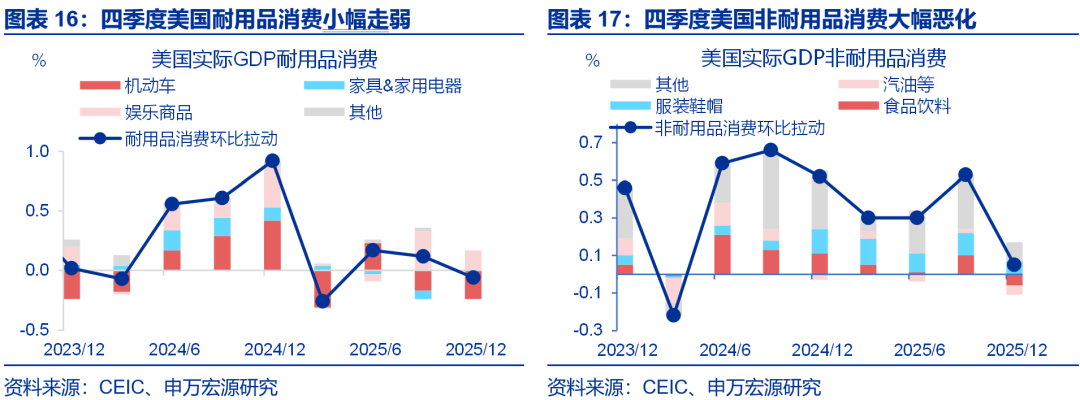
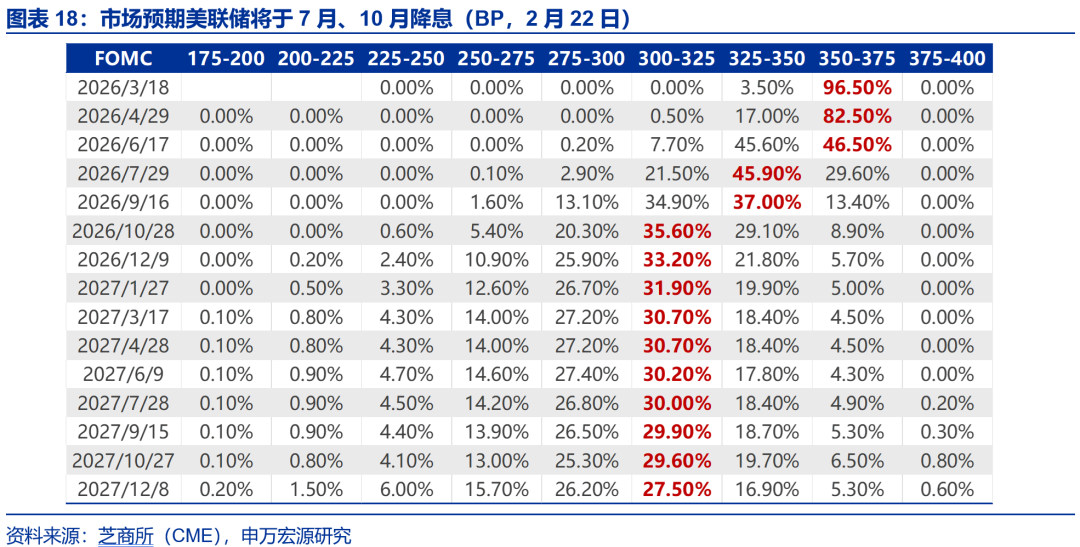
In the fourth quarter, both US household consumption of goods and services weakened. In the fourth quarter, consumption of goods and services contributed -0.01 and 1.59 percentage points respectively to the quarter-on-quarter growth rate of real GDP, compared to 0.64 and 1.70 percentage points respectively in the third quarter, indicating a greater weakening in goods consumption. Within the goods consumption structure, the significant weakening in non-durable goods consumption may have been indirectly impacted by the government shutdown (such as the interruption of food stamp distribution), while the drag on durable goods consumption was mainly from motor vehicles.
(ii) Federal Reserve: January minutes show highly divergent views among officials
The minutes of the January 2026 US economic data release revealed a significant divergence of opinions among officials. Besides the mainstream wait-and-see approach and the rate-cutting camp, the minutes explicitly stated for the first time that "some participants indicated support for a 'two-way' wording in forward guidance on interest rates, meaning that a policy rate hike is possible, provided that inflation continues to exceed the target." Currently, with the job market remaining relatively stable, inflation concerns are the core focus. In addition to previous tariff-driven inflation in goods and housing inflation helping to cool service inflation, several participants also anticipated that productivity gains related to technological or regulatory developments would exert downward pressure on inflation. Notably, several participants mentioned overvalued assets and historically low credit spreads. Some participants discussed the potential vulnerabilities arising from recent developments in the AI sector, including high stock market valuations, a high concentration of market capitalization and activity in a few companies, and increased debt financing.
(III) Japanese Inflation: Japan's CPI fell to 1.5% year-on-year in January.
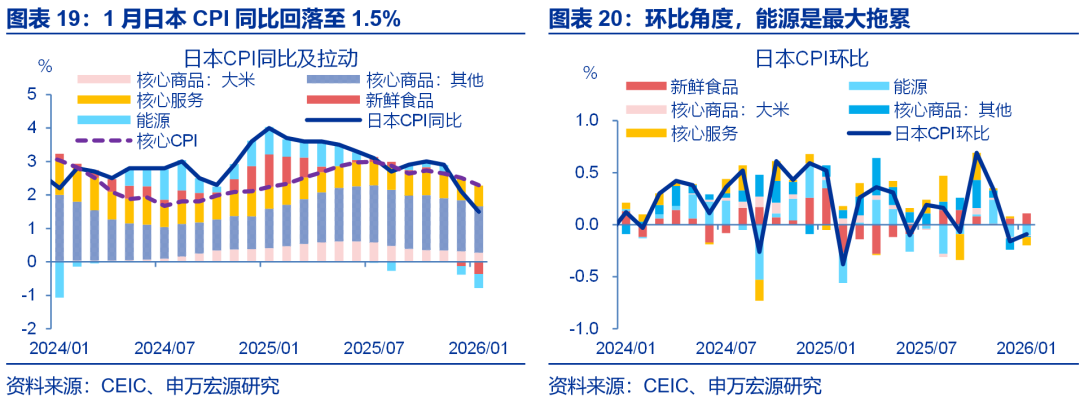
Japan's CPI fell to 1.5% year-on-year in January, with energy prices being the main contributing factor. In January 2026, Japan's CPI is projected to be 1.5% year-on-year, with core inflation continuing to weaken. The overall CPI slowdown was primarily driven by declining energy prices, influenced by the elimination of the gasoline surcharge and the continuation of fuel subsidies, while base effects also played a role. In addition, food prices maintained a slight upward trend, and core service inflation continued its cooling trend.
(iv) Japan's GDP: Japan's economic growth in the fourth quarter was weaker than market expectations.
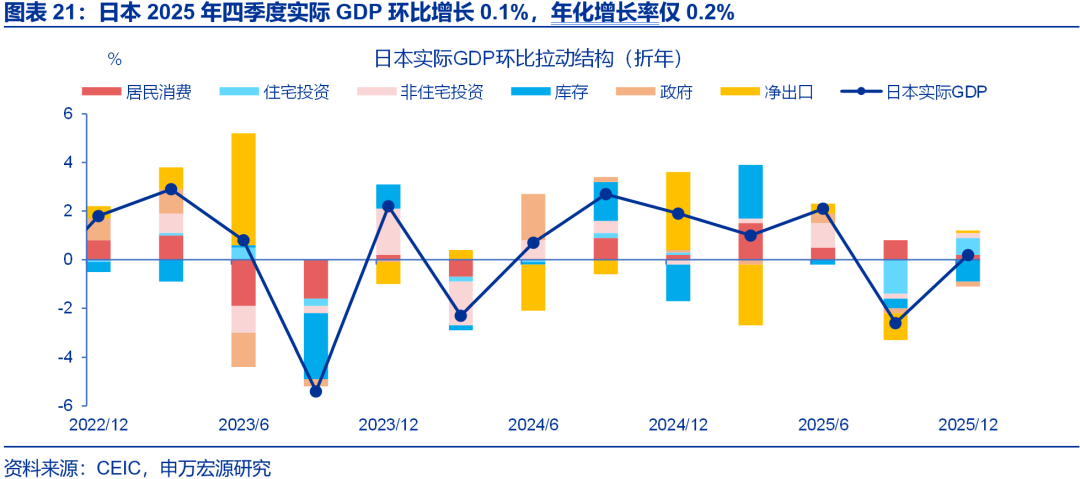
Japan's economic growth in the fourth quarter was weaker than market expectations. Japan's real GDP is projected to grow by 0.1% quarter-on-quarter in the fourth quarter of 2025, with an annualized growth rate of only 0.2%, lower than market expectations (0.4% QoQ / 1.6% annualized). Structurally, residential investment improved quarter-on-quarter in the fourth quarter, while household consumption weakened slightly. Attention should be paid to the outcome of Japan's 2026 "Spring Election."
(v) The U.S. Supreme Court ruled that reciprocal tariffs were illegal.
Breaking News: On February 20, 2026, the U.S. Supreme Court ruled 6-3 that Trump's "reciprocal tariffs" were illegal.
On February 20, 2026, the U.S. Supreme Court ruled that the reciprocal tariffs were illegal. The core reasons for the ruling were that the reciprocal tariffs violated the principles of clear authorization and significant issues. The former refers to the fact that the International Economic Partnership Agreement (IEEPA), upon which Trump based his tariffs, did not contain the terms "tariffs" or "duties," thus violating the core principle that executive authorization must be clear and explicit. The latter refers to the fact that major economic policies affecting the entire economy require explicit legal authorization from Congress, which did not provide any such authorization in the IEEPA. The tariffs that Trump was found illegal included: 1) Fentanyl tariffs. Specifically, the tariff rate was 20% for China (10% was temporarily waived in November), 25% for Canada, and 25% for Mexico; 2) Global reciprocal tariffs, including a 10% base tariff and country-specific additional tariffs.
The Supreme Court ruling did not address tax refund arrangements; how, to whom, and when refunds will be issued remain unclear, making a full refund unlikely. 1) The refund process has been separated from the legal process and is being executed independently. The Supreme Court has delegated refund issues to the CIT court, which may result in a lengthy refund process. 2) Not all equivalent tariffs will be refunded. According to U.S. Customs data, as of November 2025, total revenue from equivalent tariffs was $133.5 billion. The amount refunded depends on how lower courts handle the scope of relief. The upper limit is a full refund, the lower limit is a refund only to the direct plaintiff, and the baseline scenario is a partial refund within a limited scope. Imported goods for which preservation measures have been taken or for which defenses have been raised are more likely to receive a refund. 3) The probability of an automatic full refund is low. Referring to the principle of balancing judicial remedies (Trump v. CASA, 2025), the scope of relief must match the plaintiff's harm; a full, automatic refund may not be legally supported. Refunds may require manufacturers to actively pursue litigation, and Trump has also signaled that refunds will not be expedited.
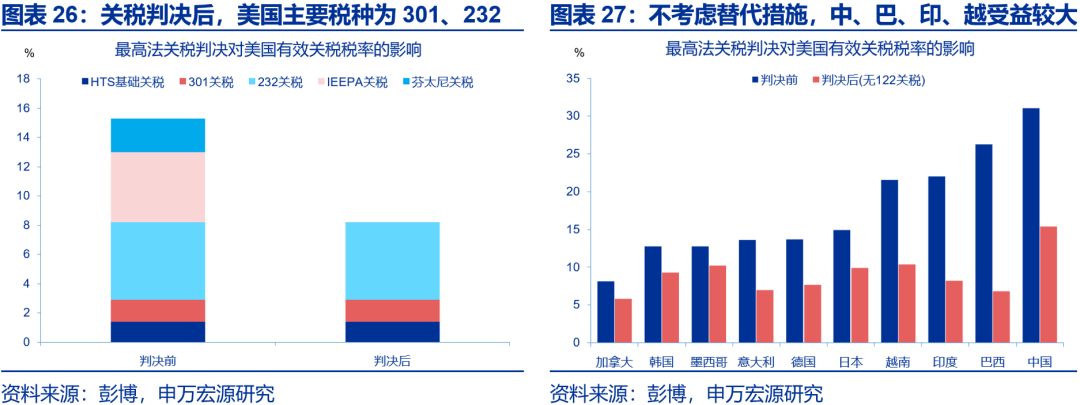
Trump took a hard line, announcing a 10% tariff increase globally based on Section 122, which was raised to 15% on the 21st, without mentioning Section 338. Following the ruling, Trump adopted a tough stance, using extreme language to criticize the Supreme Court justices who opposed the tariffs, calling them a "national disgrace." In terms of concrete measures, Trump announced a 10% tariff increase globally based on Section 122 on the 20th, raising it to the 15% cap on the 21st. Exemptions were granted for key minerals, natural resources, agricultural products, pharmaceuticals, electronics, automobiles, and aerospace products, as well as products compliant with the USMCA agreement. Furthermore, the 122 tariffs did not overlap with the 232 tariffs, or the 122 tariffs were used to buy time for a medium-term arrangement of subsequent Section 301 and 232 tariffs, but the 50% tariff measure under Section 338 was not mentioned.
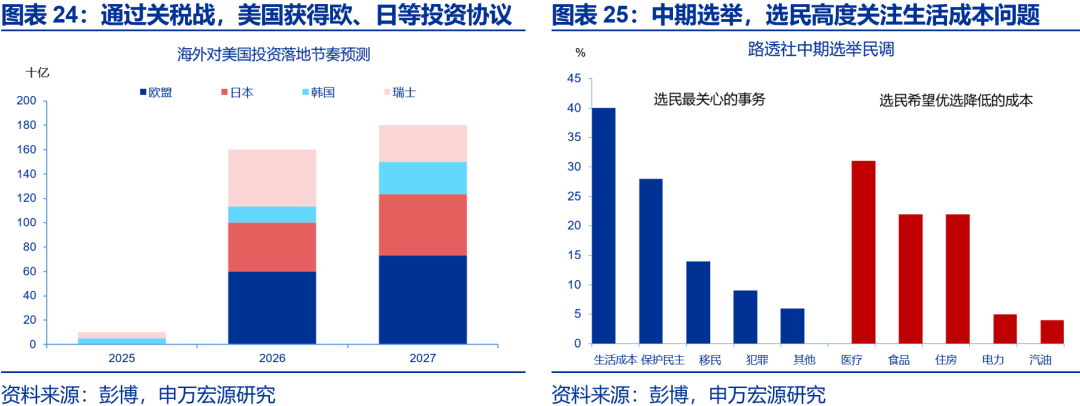
Trump's tariff strategy may be to maintain the existing tariff framework and prevent the gains from the tariff war from being wiped out, but not necessarily to escalate significantly again. By 2025, the Trump administration had achieved two major results through the tariff war: fiscal revenue and investment agreements. Thanks to tariffs, the US deficit rate was projected to drop to 6.0% by 2025, and $1.7 trillion in investment commitments were secured from countries such as Europe, Japan, and South Korea. If reciprocal tariffs were illegal, Trump's achievements since the beginning of his second term could be wiped out, giving him a strong incentive to maintain tariffs and preserve his tough image. On the other hand, under electoral pressure, launching a new round of tariff escalations might not be in Trump's electoral interest. Therefore, maintaining the existing tariff structure may be a priority for the Trump administration.
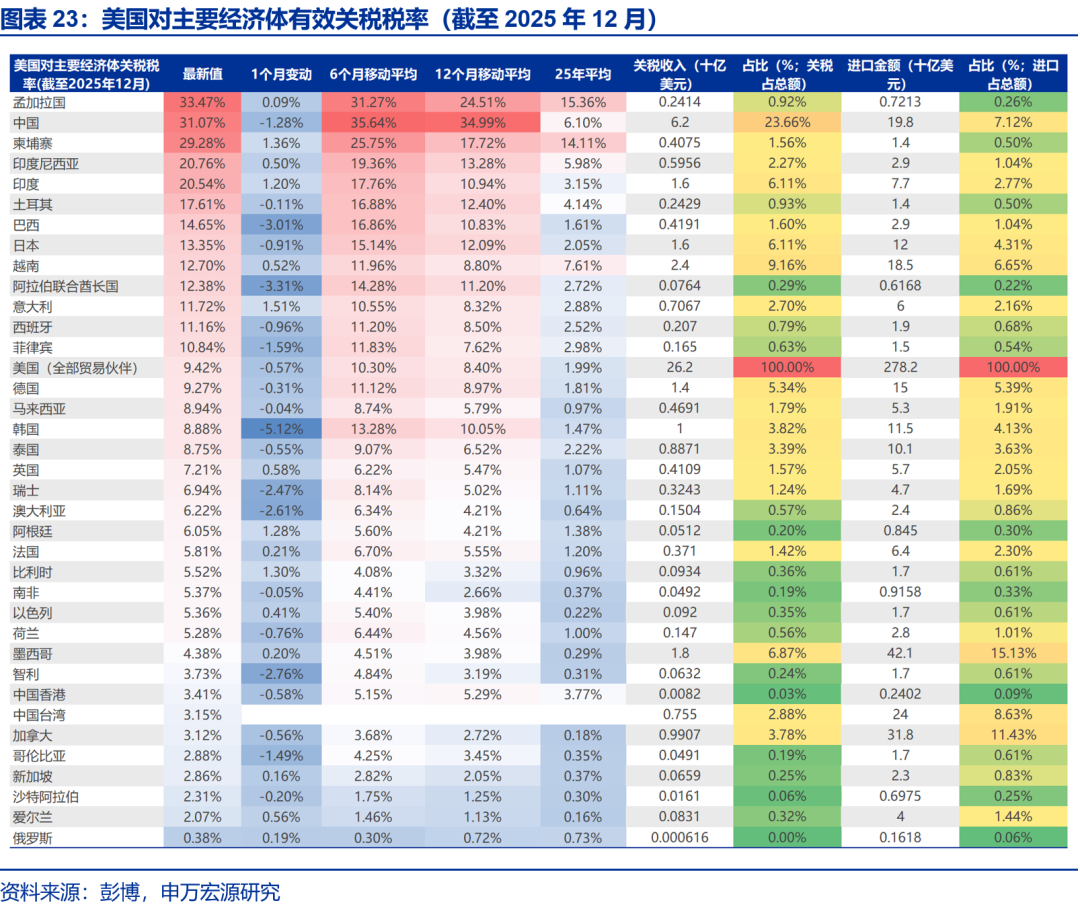
Without considering the alternative measures to Section 122 tariffs, the expiration of the reciprocal tariffs could reduce the effective US tariff rate by 7-8 percentage points. Before the tariff ruling, the US effective tariff rate globally was 16.9%, with 31.07% for China, 22% for India, 14.9% for Japan, 21.6% for Vietnam, 13.6% for Italy, 13.7% for Germany, and 12.8% for South Korea. After the expiration of the reciprocal tariffs, without additional measures, the effective US tariff rate may drop to 9.1%, the rate for China to 15.4%, India to 8.2%, Japan to 9.9%, Italy to 7.0%, Germany to 7.7%, and South Korea to 9.3%. China, Brazil, India, and Vietnam will benefit significantly.
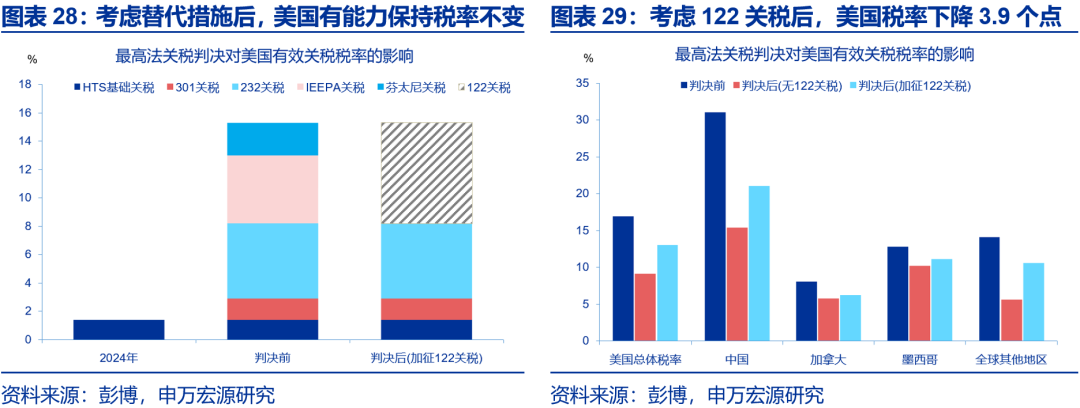
Considering alternative measures to Section 122 tariffs, the US tariff rate may only decrease by 3-4 percentage points. After the reciprocal tariffs expired, Trump immediately invoked Section 122, which, at a 10% tariff rate, would reduce the effective US tariff rate by 3.9 percentage points. However, with Section 122 expiring, if the US relies on Sections 232 and 301 to fill the gap, it may need to expand the 301 tariffs from China to multiple major trading partners and further broaden the scope of the 232 tariffs.
(vi) The Japanese election has concluded, and the Liberal Democratic Party has expanded its seats.
Breaking News: On February 18, the Japanese Diet held elections for prime minister in both the House of Representatives and the House of Councillors. Sanae Takaichi was re-elected as Japan's 105th prime minister.
The Japanese elections concluded, with the Liberal Democratic Party (LDP) expanding its seat count. On January 23, Sanae Takaichi dissolved the House of Representatives. On February 8, Japan held its 51st House of Representatives election, in which the LDP, led by Takaichi, won 316 seats, achieving a two-thirds majority on its own. The ruling coalition of the LDP and the Japan Restoration Party won 352 seats. On February 18, the Japanese Diet held elections for prime minister, and Sanae Takaichi was re-elected as Japan's 105th prime minister.
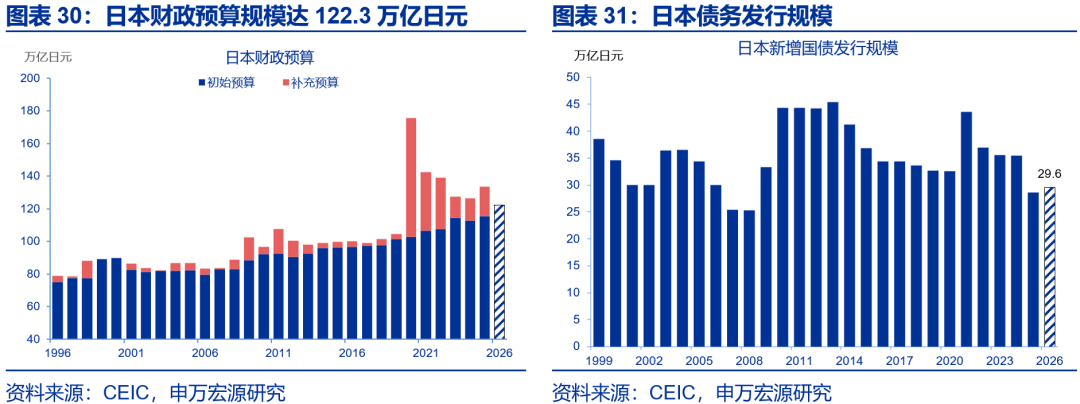
Following the election, Japan's macroeconomic policy direction remains focused on loose fiscal policy, though the pace may be more cautious. The risk of runaway debt has eased somewhat. After the Japanese bond and currency shock in late January, the Liberal Democratic Party (LDP) has become more cautious in its statements regarding loose fiscal policy and a weak yen. To avoid market concerns, the market has downplayed its tax cut promises. The post-election priority may be stabilizing debt risks; further widening the fiscal deficit could trigger greater market volatility, potentially repeating the history of British Prime Minister Truss's hasty resignation in 2022.
Lowering the food tax rate is a key commitment. Kaohsiung City has pledged to suspend the food tax for two years. Given the strong political element of tax cuts, if the Liberal Democratic Party (LDP) gains a significant advantage in the election, there may be more room for adjustment regarding the magnitude and pace of tax cuts. Since February, to avoid market concerns, Kaohsiung City has downplayed its tax cut promises during the election campaign. After the election, the LDP may adopt a more moderate alternative tax cut plan. Long-term interest rates are still trending upward, but with the LDP's growing advantage, the necessity for competitive fiscal expansion to gain votes has decreased, and concerns about disorderly interest rate increases have eased in the short term.
(vii) The US-Iran negotiations have reached a stalemate, and the US has issued an ultimatum.
Breaking News: From February 17 to 18, 2026, the US and Iran held their second round of negotiations in Geneva, Switzerland, but failed to reach an agreement.
US-Iran negotiations have stalled, with the US issuing an ultimatum. On February 6, the first round of talks between the two sides was held in Oman, marking their first formal diplomatic contact since the June 2025 conflict. The US announced a new round of sanctions against Iran on the same day. On February 10, Trump stated that he did not rule out sending a second aircraft carrier to the Middle East to bolster US military preparedness. On February 11, Trump stated that negotiations and reaching an agreement remained the priority. From February 17 to 18, the US and Iran held a second round of indirect negotiations in Switzerland. The two sides reached only a weak consensus on procedural "guiding principles," with significant differences on core issues. Iran demanded the complete lifting of all sanctions, while the US demanded that Iran abandon its highly enriched uranium activities, limit its ballistic missile development, and insist that Iran fulfill its obligations first. On February 19, Trump stated that if a "meaningful agreement" could not be reached within 10-15 days, the US would take "further military action." Iran stated that it would launch a "legitimate and unlimited retaliation" should it be attacked. In the future, geopolitical risks between the US and Iran may still rise.
III. Domestic Data & Events: Travel intensity continued to rise during the Spring Festival holiday, with both traditional and specialty travel showing increased activity.
During the Spring Festival holiday, travel continued to rise; structurally, both traditional and specialty tours saw a rebound in popularity. In contrast, movie consumption weakened, with both the number of moviegoers and the average ticket price declining.
(a) Travel intensity continued to rise during the Spring Festival holiday, with both traditional and specialty tours seeing increased activity.
News Highlights: During the first six days of the 2026 Spring Festival holiday, the total number of cross-regional passenger flows reached 1.72 billion, with the average daily passenger flow increasing by 4.6% year-on-year, and 0.9 percentage points higher than during the Spring Festival travel rush.
Summarize:
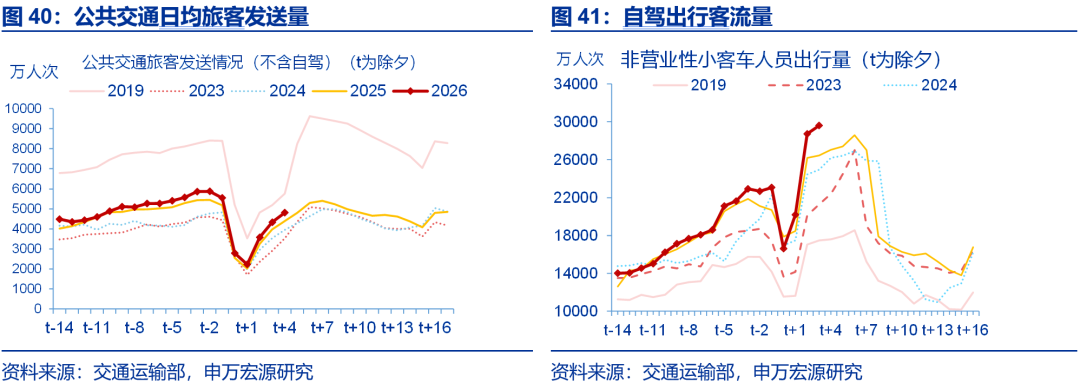
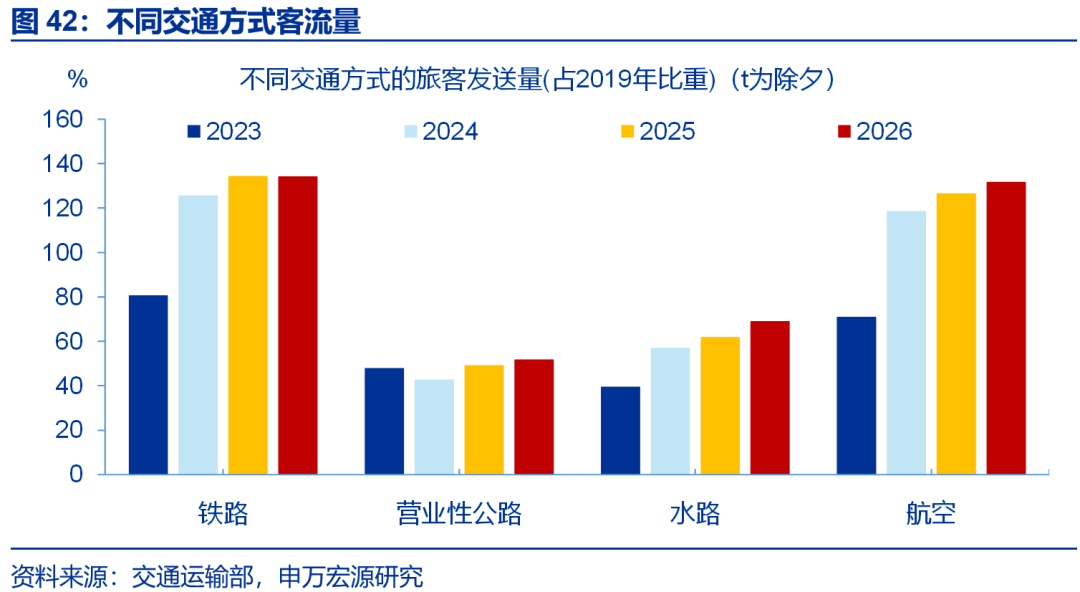
Feature 1: During the 2026 Spring Festival travel rush, the travel pace was later and concentrated in the three days before Lunar New Year's Eve. After the start of the 2026 Spring Festival travel rush, the total cross-regional flow of people remained around 1.5% year-on-year; however, the flow intensity increased significantly in the three days before Lunar New Year's Eve (from the 26th to the 28th of the twelfth lunar month), reaching a peak (6% year-on-year), indicating a more concentrated travel rush. In terms of specific modes of transportation, the average daily passenger volume of public transportation reflecting long-distance travel (including commercial highways, railways, waterways, and air travel) increased by 5.2% year-on-year. Unlike previous years when railway passenger volume was higher, highway and air passenger volume were higher during the 2026 Spring Festival travel rush, at 6.1% and 4.4% year-on-year respectively, while railway passenger volume increased by only 2.7% year-on-year. In addition, the intensity of private car travel was relatively low, with an average daily passenger volume of only 3.3% year-on-year.
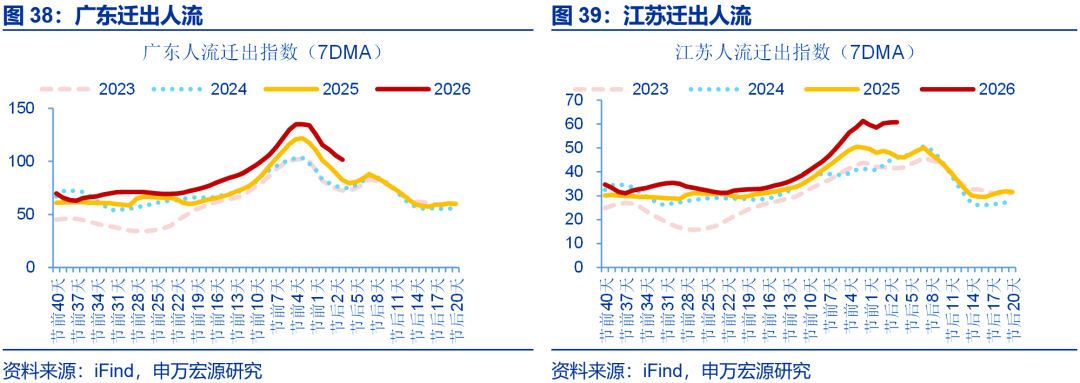
The travel patterns in typical regions also corroborate this, with the influx intensity of labor-exporting provinces and the outflow intensity of labor-importing provinces both reaching a peak three days before Lunar New Year's Eve. Looking at the travel directions in typical regions, the inflow intensity of labor-exporting provinces like Hubei and Guizhou rose from 1% and 2% respectively one week before Lunar New Year's Eve to 36.1% and 14.2% three days before the eve of Lunar New Year's Eve; correspondingly, the outflow intensity of major labor-importing provinces such as Guangdong and Jiangsu also rose from around 4% and 5% respectively one week before Lunar New Year's Eve to 18.5% and 21.3% three days before Lunar New Year's Eve.
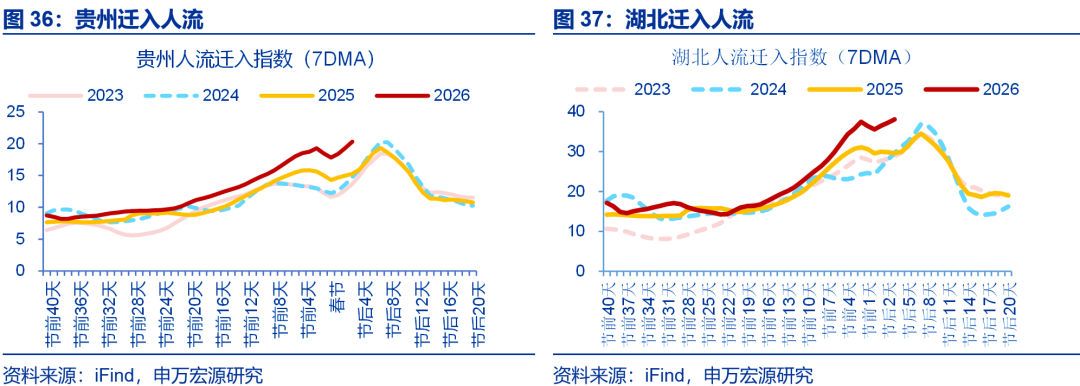
Feature Two: Travel intensity further increased after the third day of the Spring Festival holiday, potentially indicating a strong release of holiday travel demand. During the first six days of the Spring Festival holiday (February 15th to February 20th), the average daily passenger flow increased by 0.9 percentage points year-on-year to 4.6% compared to the Spring Festival travel rush. In terms of timing, travel intensity increased after the third day of the Spring Festival holiday (February 17th, the first day of the Lunar New Year), rising from -5% year-on-year to 12.3%; this was mainly due to a rebound in self-driving travel, rising from -7.1% year-on-year to 12%. The average daily passenger volume of public transportation also increased, rising by 5.8 percentage points year-on-year to 11% compared to the Spring Festival travel rush; among them, highway passenger traffic saw a significant increase, rising by 7.7 percentage points year-on-year to 13.7%, while the average daily passenger volume of railways and civil aviation rebounded by 3.2 and 1.6 percentage points year-on-year to 5.9% and 6.1%, respectively.
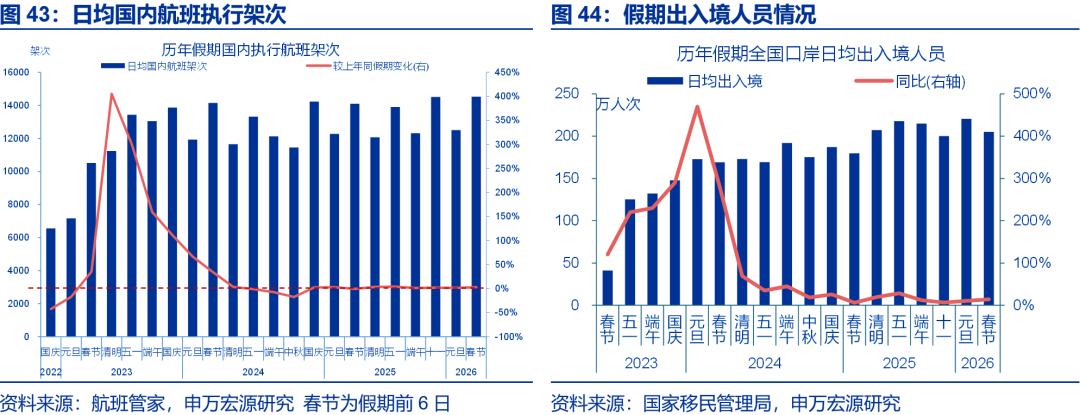
Feature Three: In terms of flight operations, domestic flight operations continued to rise, while cross-border travel activity declined. Domestic flight operations increased, with the number of flights operating from the first to the sixth day of the Spring Festival holiday increasing by 3% year-on-year and 1 percentage point higher than the National Day holiday in 2025. In contrast, cross-border travel activity declined. The National Immigration Administration predicts that the average daily number of people passing through ports nationwide during the 2025 Spring Festival holiday will reach 2.05 million, a 7% decrease compared to the New Year's Day holiday. From the first to the sixth day of the holiday, international flight operations increased by 1.3% year-on-year and 9.1 percentage points lower than the National Day holiday in 2025. Outbound travel saw a significant decline, with flights from China to Japan and Cambodia decreasing by 70.4 and 50 percentage points year-on-year to -47.7% and -10%, respectively, compared to the National Day holiday in 2025. Inbound travel remained strong. Data from Qunar shows that on the first day of the Spring Festival holiday (February 15), the number of domestic flights booked using non-Chinese passports increased by nearly 20% year-on-year.
Feature 4: From the perspective of tourist destinations, the popularity of traditional scenic spots rebounded during the holiday, while distinctive tourism such as "intangible cultural heritage tourism" performed exceptionally well. During the first four days of the holiday, the average daily sales of key retail and catering enterprises nationwide increased by 8.6% year-on-year, 5.9 percentage points higher than the National Day holiday in 2025. UnionPay and NetsUnion's cumulative transactions reached 9.78 trillion yuan, a year-on-year increase of 15.0%. Regarding travel destinations, the popularity of traditional scenic spots rebounded. For example, the number of visitors to A-level scenic spots in Sichuan Province (from the first to the fifth day) increased by 10.2% year-on-year, 1.9 percentage points higher than the National Day holiday in 2025. Although ticket revenue declined (down 14.9 percentage points year-on-year to -8.3%), this was related to the widespread implementation of ticket reductions and exemptions, and the distribution of consumption vouchers across various regions. Driven by emotional consumption demands, Spring Festival travel showed a shift from sightseeing to immersive cultural experiences. For example, bookings for homestays in intangible cultural heritage towns such as Jieyang in Guangdong (3.8 times), Pu'er in Yunnan (2.6 times), and Kaifeng in Henan (2.3 times) saw a doubling of growth.
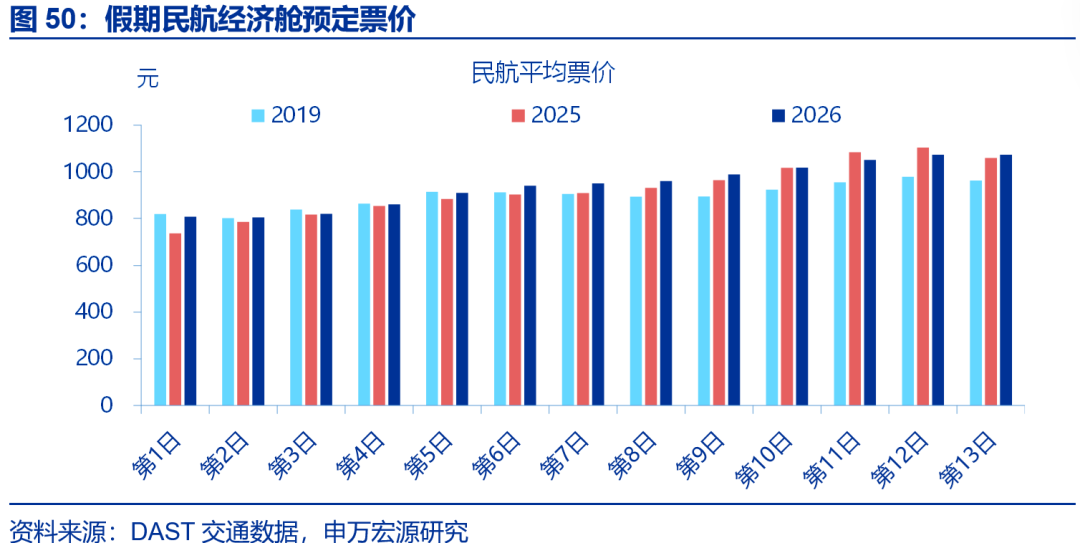
Feature 5: Overall price performance remained stable, with hotel and airfare pre-sale prices both rising compared to the same period last year. As of February 11, the average pre-sale airfare (base price) during the Spring Festival travel season was 908 yuan, higher than the average price during the same period last year (884 yuan) and the National Day holiday in 2025 (804 yuan). Regarding accommodation, as of February 14, the occupancy rates for hotels and guesthouses during the Spring Festival holiday were 37.9% and 37.6% respectively, representing increases of 0.8 and decreases of 0.9 percentage points compared to the National Day holiday. In terms of price, hotel booking prices increased by 5.4% compared to the same period last year, while guesthouse prices remained the same.
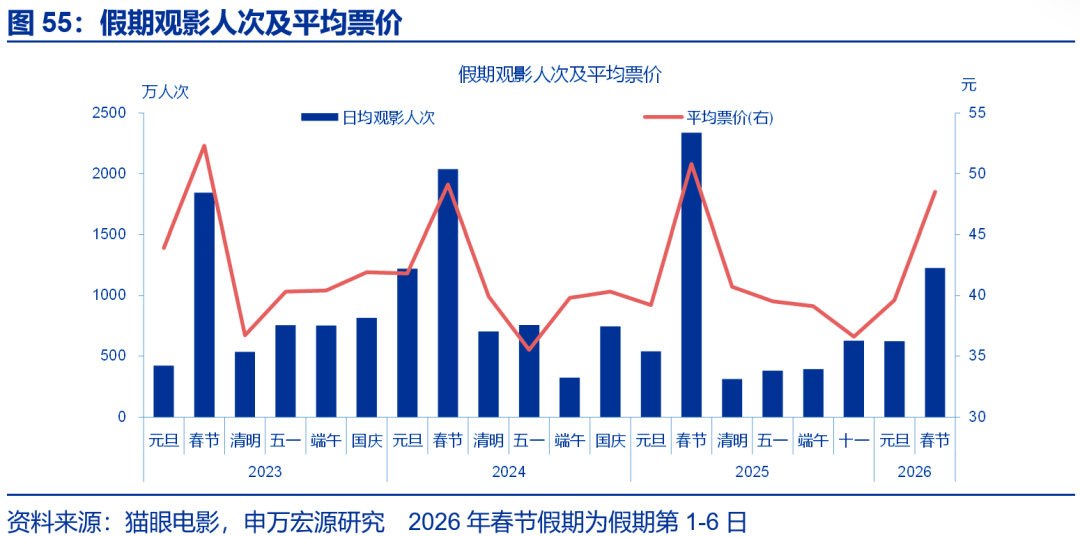
Feature Six: The film market weakened compared to the National Day holiday, with both volume and price declining. From the first to the sixth day of the holiday, national box office revenue fell by 23.9 percentage points year-on-year to -47.6% compared to the National Day holiday in 2025. Breaking down volume and price, the average ticket price during the Spring Festival holiday fell by 4.5% year-on-year, a decrease of 12.7 percentage points compared to the National Day holiday; the number of moviegoers fell by 47.5% year-on-year, a decrease of 31.6 percentage points compared to the National Day holiday. Movie consumption weakened across different city tiers, with first-tier and second-tier cities seeing box office revenue declines of 16.1 and 25 percentage points year-on-year to -49.4% and -51.7%, respectively, compared to the National Day holiday.
(ii) Real estate transactions were sluggish, with a significant decline in transactions in first-tier cities.
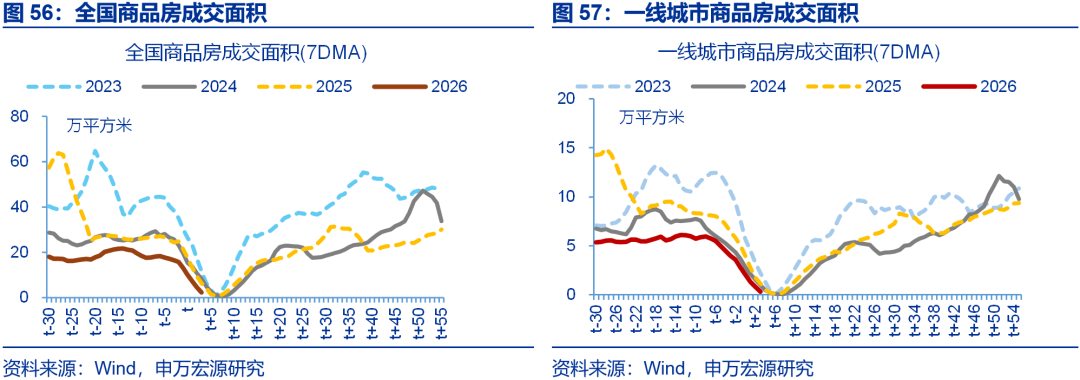
News Highlights: During the first six days of the Spring Festival holiday (February 15 to February 20), the total transaction area of commercial housing in 30 major and medium-sized cities was 102,000 square meters, with the average daily transaction area down 43% year-on-year.
Summarize:
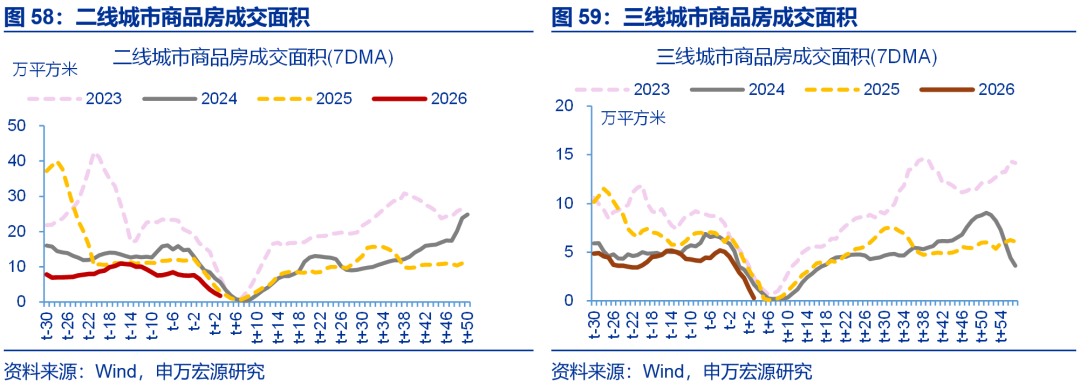
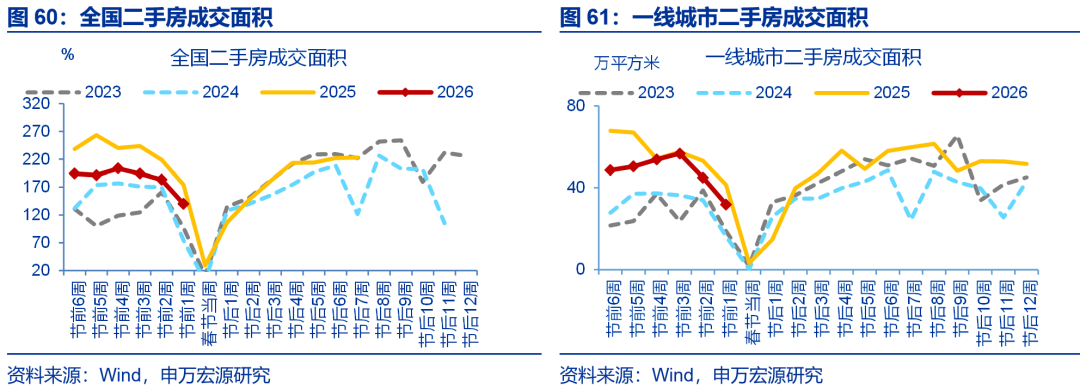
During the Spring Festival holiday, both new and existing home sales were weak nationwide, with a significant decline in sales in first-tier cities. From February 15th to 20th (the first six days of the holiday), the total sales area of commercial housing in 30 major cities was 102,000 square meters, a year-on-year decrease of 43%, and a drop of 10.6 percentage points compared to the week before the holiday. Structurally, the decline in sales area was more pronounced in first-tier cities, falling 14.7 percentage points year-on-year to -46.8% compared to the week before the holiday. The decline was relatively smaller in second- and third-tier cities, with year-on-year decreases of 7.4 and 12.5 percentage points respectively, to -40% and -45.2% compared to the week before the holiday. Existing home sales also declined nationwide, with a year-on-year decrease of 3.6 percentage points to -20% in the week before the holiday compared to the two weeks prior; among them, the sales area of existing homes in first-tier cities fell 7.6 percentage points year-on-year to -22.8%.
(III) Industrial production is generally positive, but construction starts show mixed performance.
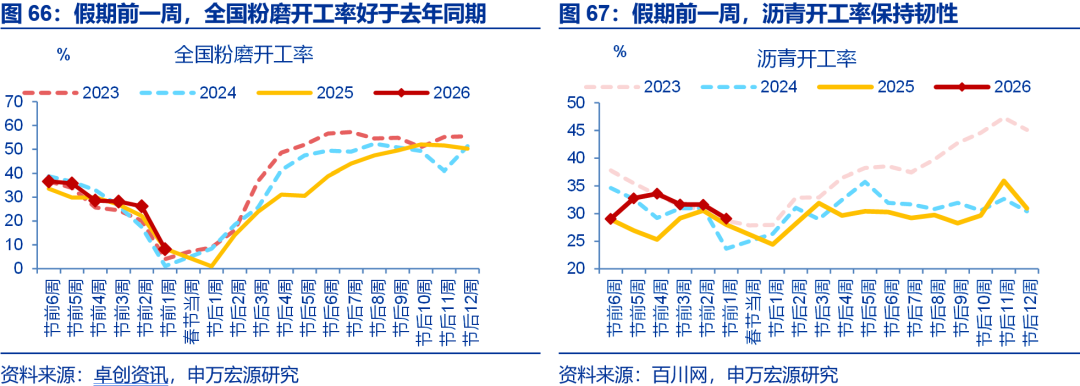
Key News: In the week leading up to the Spring Festival holiday (February 9 to February 15), industrial production saw a rebound in both the metallurgical and petrochemical chains. Construction activity was mixed; grinding mills, reflecting real estate investment, saw a decline in operating rates, while asphalt plants, reflecting infrastructure investment, maintained resilience.
Summarize:
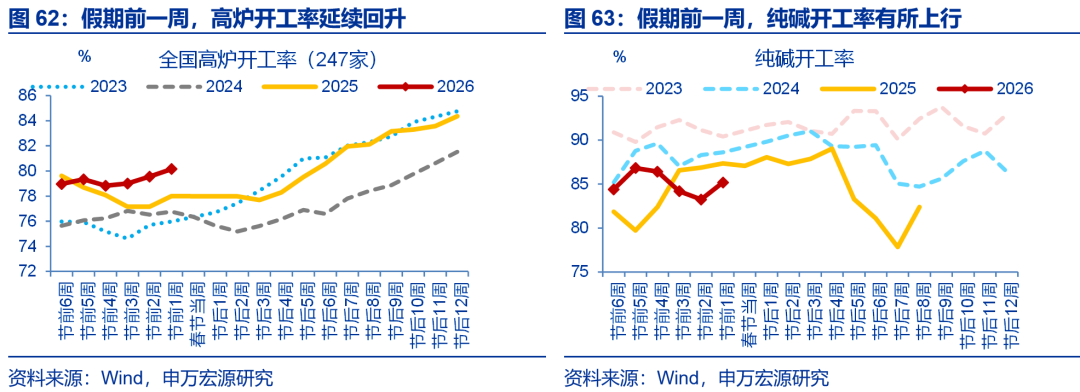
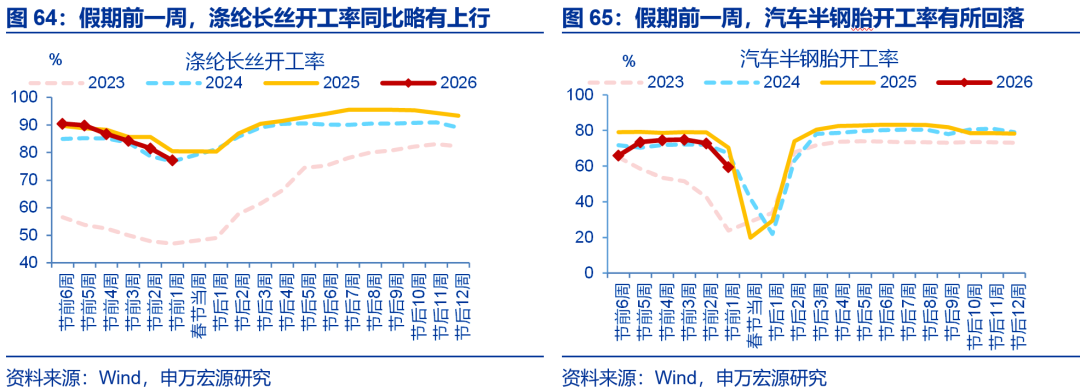
Ahead of the Spring Festival holiday, industrial production generally performed well, while construction activity showed mixed results. In the week leading up to the holiday (February 9th to February 15th), blast furnace operating rates continued to rise (0.6% week-on-week) and remained at 2.2% year-on-year. The petrochemical chain also saw improvement, with soda ash and polyester filament operating rates rebounding by 1.5 and 0.9 percentage points year-on-year to -2.2% and -3.3%, respectively. In contrast, the semi-steel tire operating rate for automobiles was weaker, falling by 4.8 percentage points year-on-year to -10.9%. Regarding construction activity, the national grinding mill operating rate, which better reflects real estate investment, weakened, falling by 4.2 percentage points year-on-year to -0.1%; while the asphalt operating rate remained resilient, maintaining at 1.1% year-on-year.
(iv) The divergence in inflation in January was due to a combination of factors, including the timing of the Spring Festival, imported inflation, and weak demand.
Breaking News: On February 11, the National Bureau of Statistics released January inflation data. The CPI rose 0.2% year-on-year, compared to 0.8% in the previous month, an expected 0.4%, and 0.2% month-on-month; the PPI fell 1.4% year-on-year, compared to -1.9% in the previous month, an expected -1.5%, and 0.4% month-on-month.
Summarize:
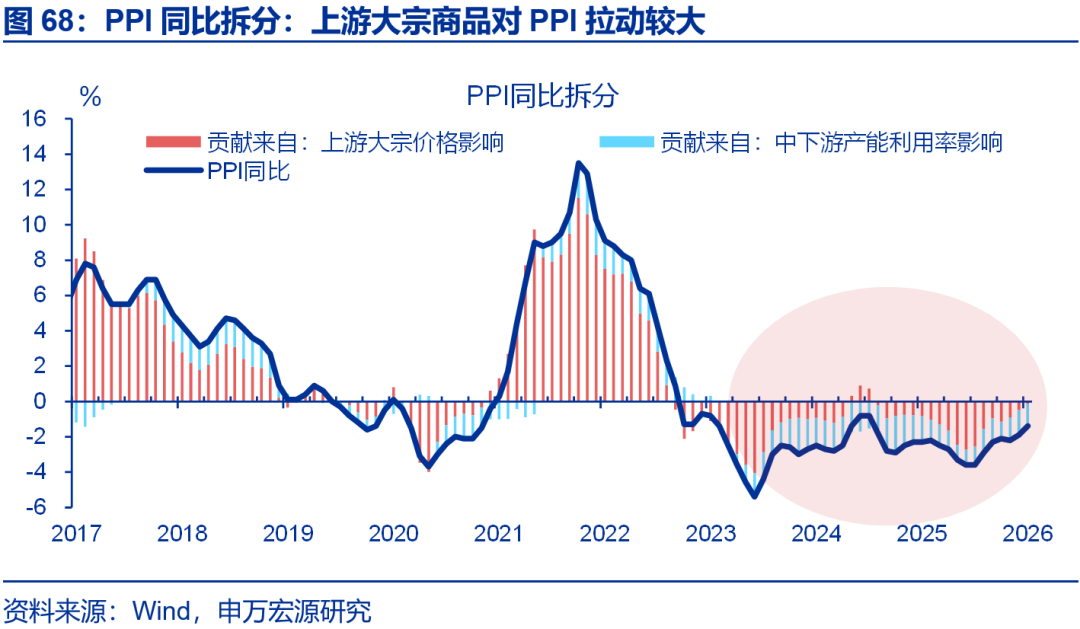
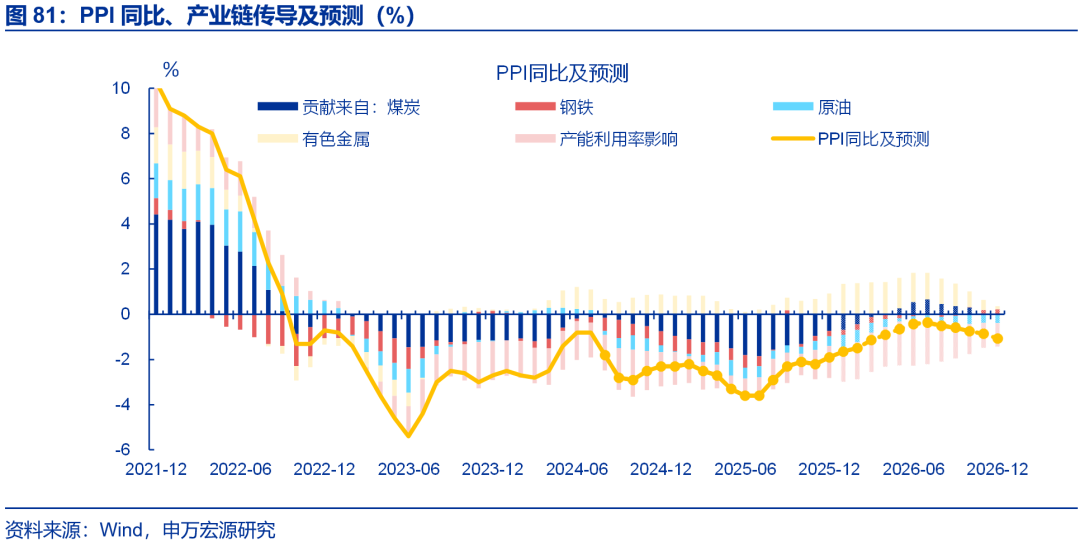
The decline in PPI narrowed significantly in January, mainly due to the further increase in the contribution of copper prices to PPI, with the base period rotation also having some impact. January's PPI rose 0.4% month-on-month and increased by 0.5 percentage points year-on-year to -1.4%. my country's price index undergoes a base period rotation every five years, with a new round of adjustment starting in 2026. Calculations suggest that this base period rotation will have an average impact of approximately 0.08 percentage points on the monthly year-on-year PPI, which is relatively small. More importantly, copper prices further increased in January (9.3% month-on-month), with corresponding month-on-month increases of 5.7% and 5.2% in non-ferrous metal mining and rolling, respectively, contributing 0.5% to the PPI month-on-month, making it the strongest contributor. Steel prices also contributed positively to the PPI, contributing 0.1% to the month-on-month increase.
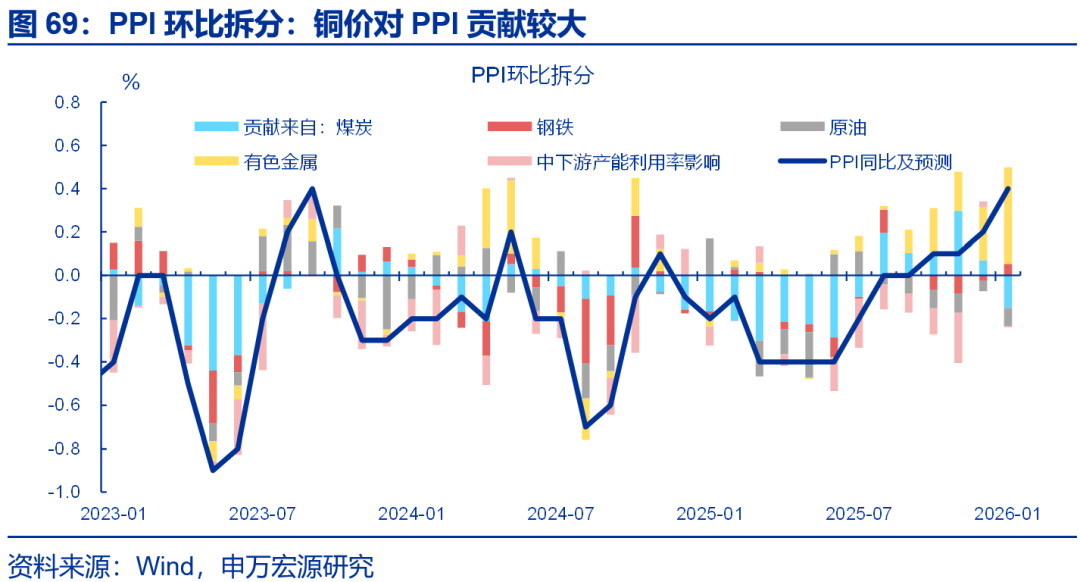
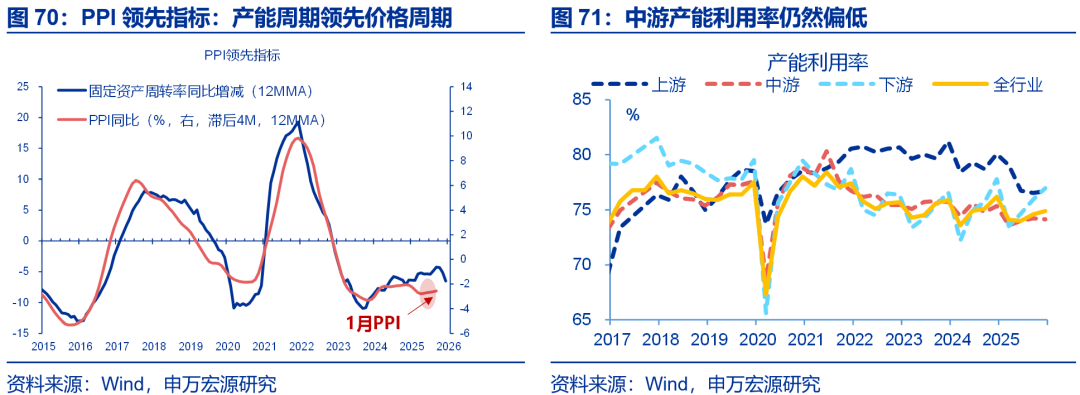
In contrast, prices of commodities such as kerosene and the performance of downstream PPI were relatively weak. The decline in international crude oil prices led to a 3.1% and 2.5% decrease in domestic oil extraction and refining prices, respectively, dragging down the PPI by 0.08% month-on-month. Coal prices also weakened, dragging down the PPI by 0.15% month-on-month. Downstream capacity utilization rates did not improve significantly, resulting in a relatively limited impact of upstream price increases on downstream sectors, estimated to have only contributed 0.1% to the PPI month-on-month. Specifically, the PPI for the alcohol and beverage and pharmaceutical industries decreased by 1.4% and 0.9% month-on-month, respectively.
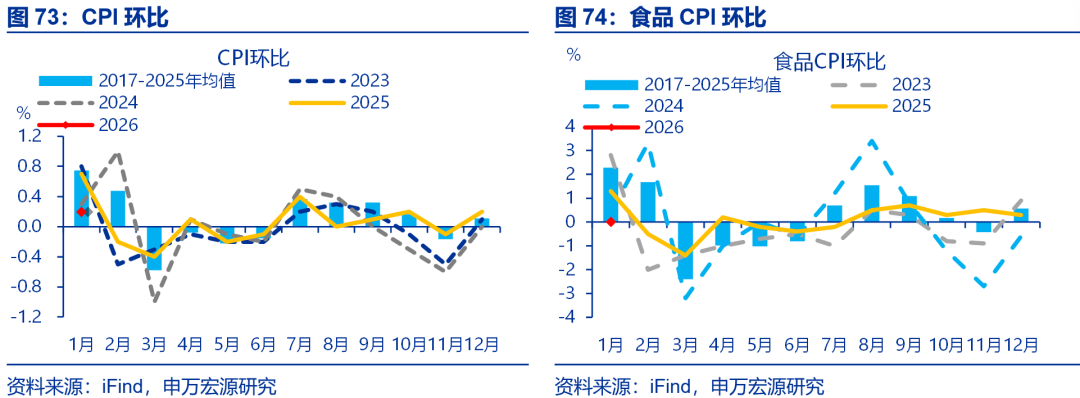
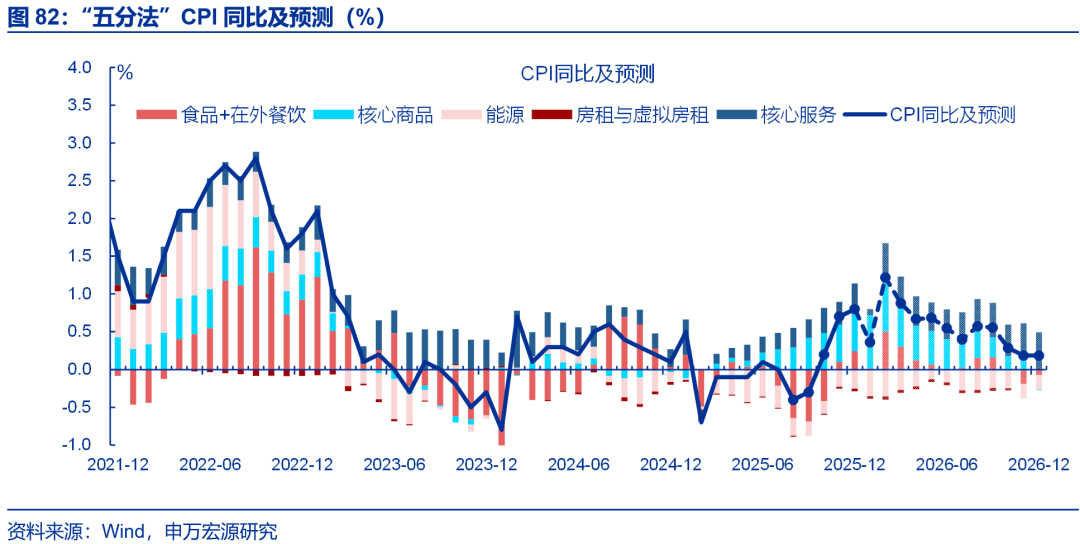
Affected by the timing of the Spring Festival, the CPI in January saw a significant year-on-year decline; however, excluding this factor, the overall CPI remained weak. The National Bureau of Statistics calculated that this round of base period rotation contributed 0.06 percentage points to the monthly CPI year-on-year growth. The timing of the 2026 Spring Festival differs from that of 2025, resulting in a 0.6 percentage point year-on-year decline in the January CPI to 0.2% due to the high base effect. The January CPI month-on-month growth of only 0.2%, significantly lower than the CPI performance in previous years before the Spring Festival (0.6%), reflects the overall weakness of the CPI. Structurally, the food CPI saw a significant year-on-year decline, falling 1.8 percentage points to -0.7% from the previous month. Specifically, the CPI for fresh vegetables and fresh fruits fell by 11.3 and 1.2 percentage points year-on-year to 6.9% and 3.2%, respectively. The pork price, affected by the previously high inventory, remained at a low level of -13.7% year-on-year.
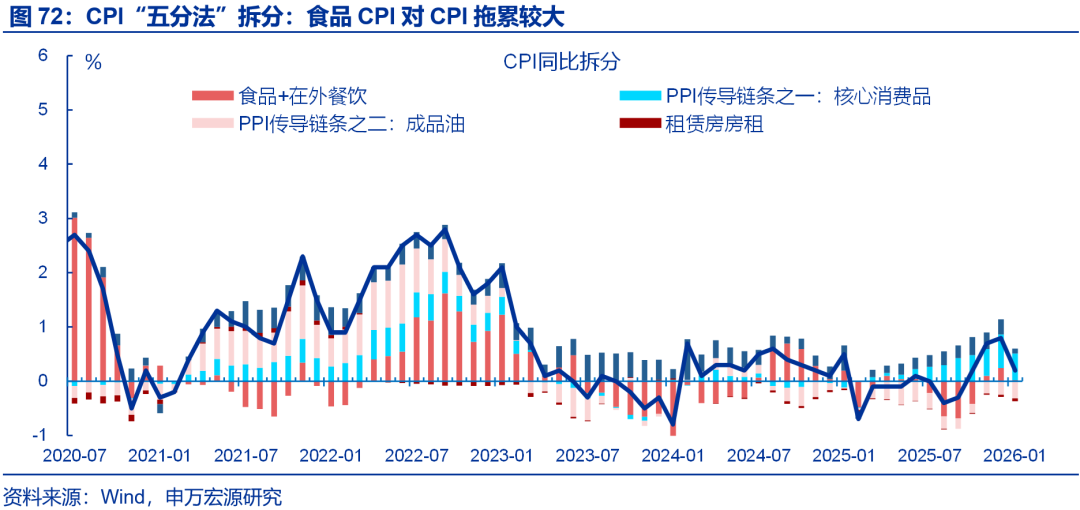
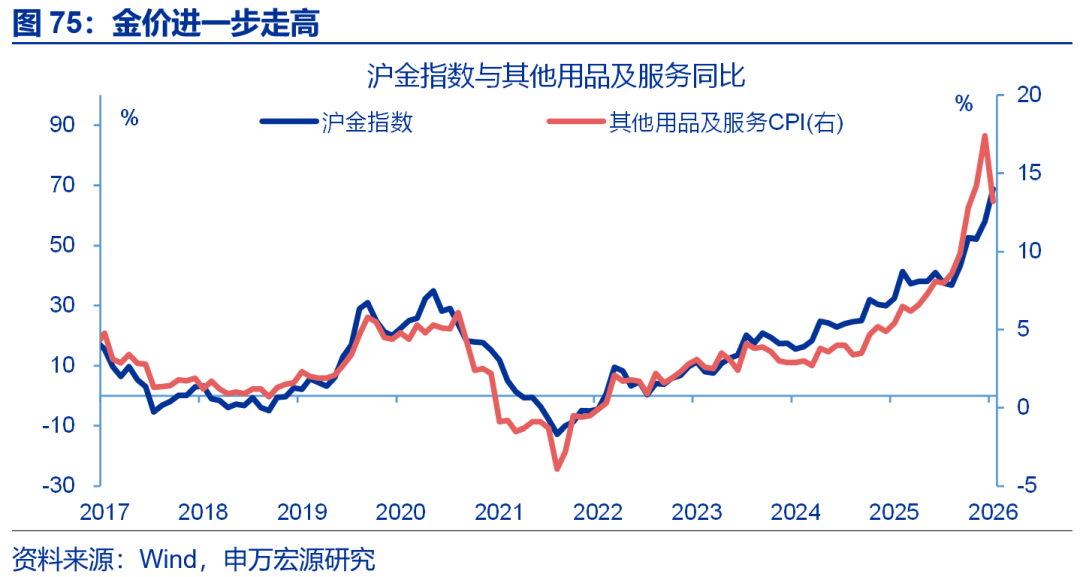
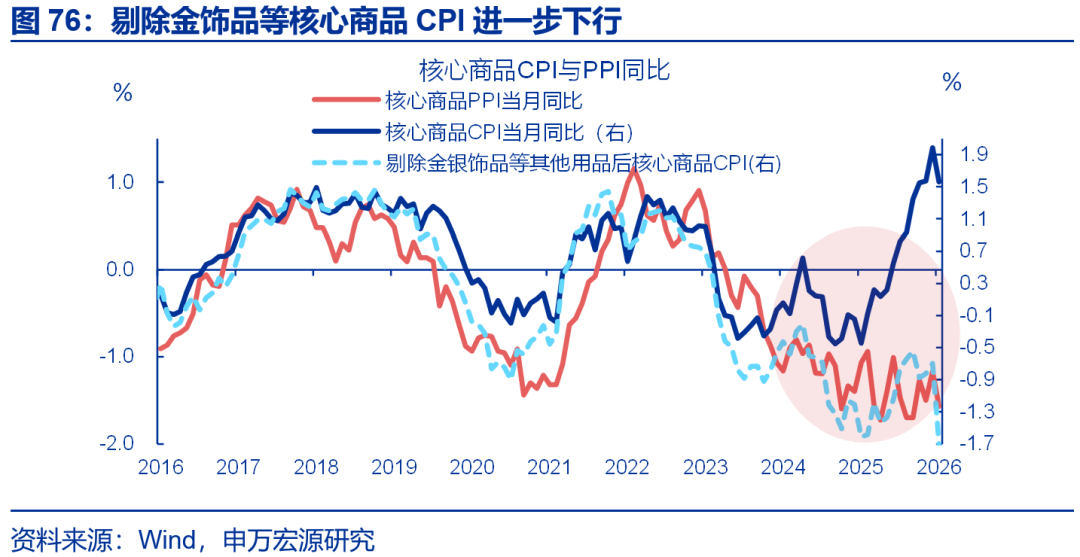
Excluding the impact of gold prices, the core commodity CPI was relatively weak. In January, the core commodity CPI fell 0.4 percentage points year-on-year to 1.6%. Breaking down the structure, gold prices rose 68.7% year-on-year in January, driving the year-on-year increase in gold jewelry prices to 77.4%; while the CPI for other core commodities excluding gold jewelry declined significantly year-on-year, falling 1 percentage point from the previous month to -1.7%. Structurally, the home appliance CPI strengthened further, likely reflecting supply-side factors related to rising raw material prices such as copper and the transmission of anti-involution effects, but prices in other sectors remained weak.
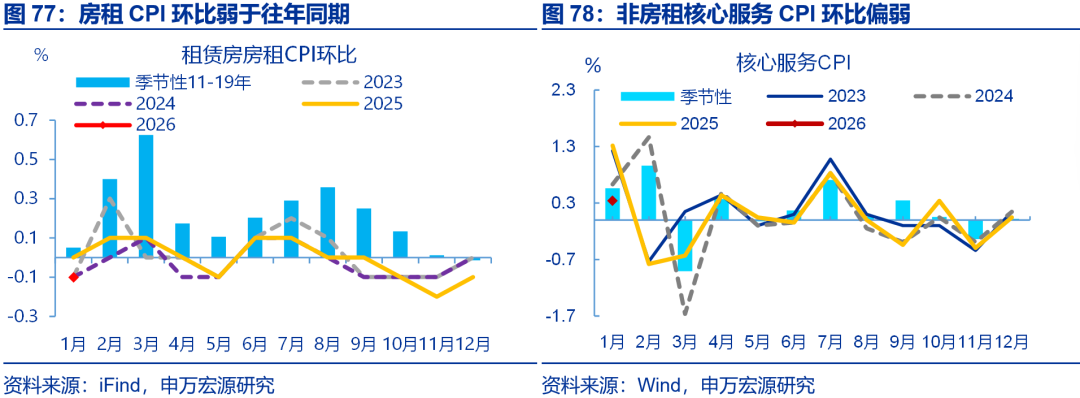
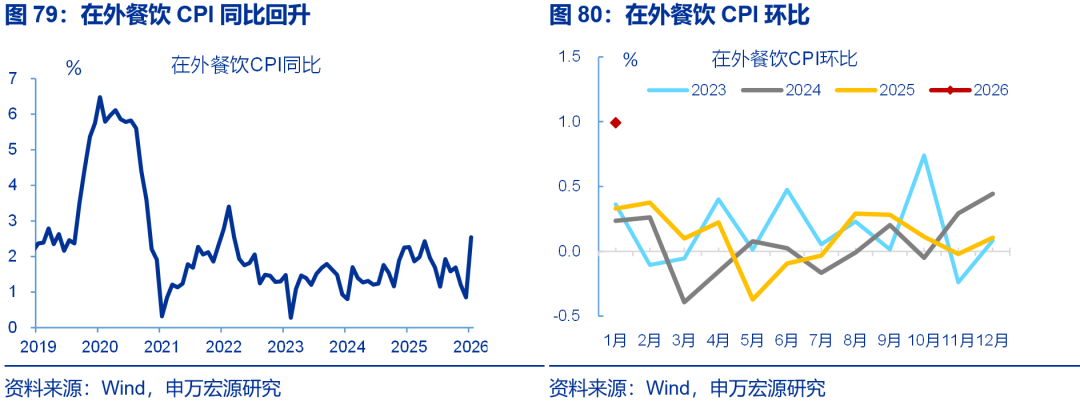
Even after adjusting for the timing of the Spring Festival, the service CPI was weaker than in previous years leading up to the holiday, possibly due to the earlier "return-home rush." Affected by the timing of the Spring Festival, the service CPI fell 0.5 percentage points year-on-year to 0.1% in January. Breaking down the components, the largest single item in the service CPI is the virtual rent CPI, which is heavily influenced by rental demand. Currently, weak rental demand caused the rent CPI to continue its year-on-year decline in January (-0.1 percentage points to -0.4%). The core service CPI was also weak, rising 0.3% month-on-month in January, lower than the service CPI performance in previous years leading up to the Spring Festival (0.6%). However, the CPI for dining out, included in the food, tobacco, and alcohol category, improved, rising 1.7 percentage points year-on-year to 2.5%.
Looking ahead: Compared to the impact of upstream price increases, the price performance of midstream and downstream sectors is more crucial. We continue to monitor the policy effects of anti-involution measures in the midstream and downstream sectors. Over the past three years, commodity prices have only explained about 30% of PPI fluctuations, with PPI prices being more affected by the "overselling" caused by involution in the midstream and downstream sectors. Even if commodity prices continue to rise, the transmission of upstream prices to downstream sectors will be hindered, and the recovery of midstream and downstream PPI may be limited. We maintain our judgment of a weak PPI recovery. Regarding CPI, the timing of the Spring Festival will result in a lower base in February, coupled with high gold prices and improved service consumption, which may drive a significant rebound in CPI. The CPI at the beginning of the year may show a "V-shaped" trend.
(V) The People's Bank of China releases financial data for January 2026.
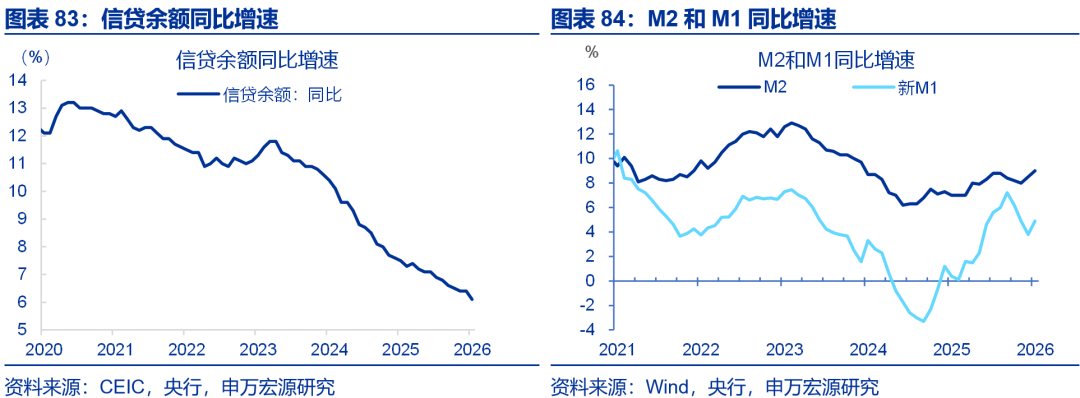
On February 13, 2026, the People's Bank of China released its financial statistics report for January 2026, which showed that RMB loans increased by 4.71 trillion yuan in January. By sector, household loans increased by 456.5 billion yuan, of which short-term loans increased by 109.7 billion yuan and medium- and long-term loans increased by 346.9 billion yuan; loans to enterprises and institutions increased by 4.45 trillion yuan, of which short-term loans increased by 2.05 trillion yuan and medium- and long-term loans increased by 3.18 trillion yuan, while bill financing decreased by 873.9 billion yuan; and loans to non-bank financial institutions decreased by 188.2 billion yuan.
Preliminary statistics show that in January 2026, the total social financing increased by 7.22 trillion yuan, 166.2 billion yuan more than the same period last year. Specifically, RMB loans to the real economy increased by 4.9 trillion yuan, 317.8 billion yuan less than the same period last year; foreign currency loans to the real economy increased by 46.8 billion yuan (equivalent to RMB), 86 billion yuan more than the same period last year; entrusted loans decreased by 19.2 billion yuan, 64.1 billion yuan less than the same period last year; trust loans decreased by 400 million yuan, 62.7 billion yuan less than the same period last year; undiscounted bank acceptance bills increased by 629.3 billion yuan, 163.9 billion yuan more than the same period last year; net financing of corporate bonds was 503.3 billion yuan, 57.9 billion yuan more than the same period last year; net financing of government bonds was 976.4 billion yuan, 283.1 billion yuan more than the same period last year; and domestic equity financing of non-financial enterprises was 29.1 billion yuan, 18.2 billion yuan less than the same period last year.
At the end of January, the broad money supply (M2) balance was 347.19 trillion yuan, a year-on-year increase of 9%. The narrow money supply (M1) balance was 117.97 trillion yuan, a year-on-year increase of 4.9%. The currency in circulation (M0) balance was 14.61 trillion yuan, a year-on-year increase of 2.7%. Net cash injection in January was 519.1 billion yuan. RMB deposits increased by 8.09 trillion yuan in January. Among them, household deposits increased by 2.13 trillion yuan, non-financial enterprise deposits increased by 2.61 trillion yuan, fiscal deposits increased by 1.55 trillion yuan, and non-bank financial institution deposits increased by 1.45 trillion yuan.
(vi) Qiushi published an important article entitled "Key Tasks of Current Economic Work"
On February 15, Qiushi Journal published an important article by General Secretary Xi Jinping entitled "Key Tasks of Current Economic Work." The article clearly states that it is necessary to adhere to domestic demand as the main driver, further implement special actions to boost consumption and expand the supply of high-quality goods and services; and to adhere to innovation-driven development, using technological innovation to lead industrial upgrading and continuously foster new productive forces. Current economic work has made systematic arrangements for promoting consumption and expanding investment, cultivating new growth drivers, and mitigating risks in key areas, further enhancing the endogenous driving force and resilience of high-quality development. This deployment of key tasks precisely shifts policy focus to implementing policies to increase the income of urban and rural residents and optimize the "two new" policies (new infrastructure and new urbanization), vigorously deepening and expanding the layout of "artificial intelligence+" and strategic emerging industries, comprehensively stimulating the vitality of various business entities, and promoting the construction of a unified national market.
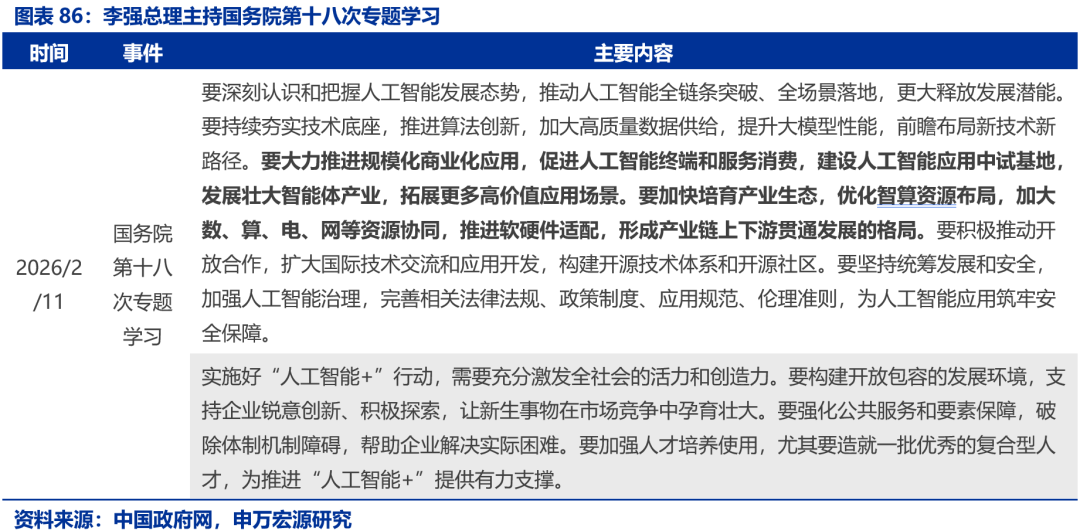
(VII) State Council Special Study: Deepen and expand "Artificial Intelligence+" to empower all industries in an all-round way
On February 11, the State Council held its 18th thematic study session on the theme of "Deepening and Expanding 'Artificial Intelligence+' and Fully Empowering All Industries." The session emphasized the need to comprehensively promote technological innovation, industrial development, and application empowerment in artificial intelligence to cultivate new productive forces. It specified the need to promote breakthroughs across the entire AI chain and its implementation across all scenarios; to solidify the technological foundation by advancing algorithm innovation, increasing the supply of high-quality data, and improving the performance of large-scale models; to promote large-scale commercial applications by promoting terminal and service consumption, building pilot production bases, and developing the intelligent agent industry; and to cultivate an industrial ecosystem by optimizing the allocation of intelligent computing resources, strengthening the synergy between data, computing, and the power grid, and promoting software and hardware adaptation.
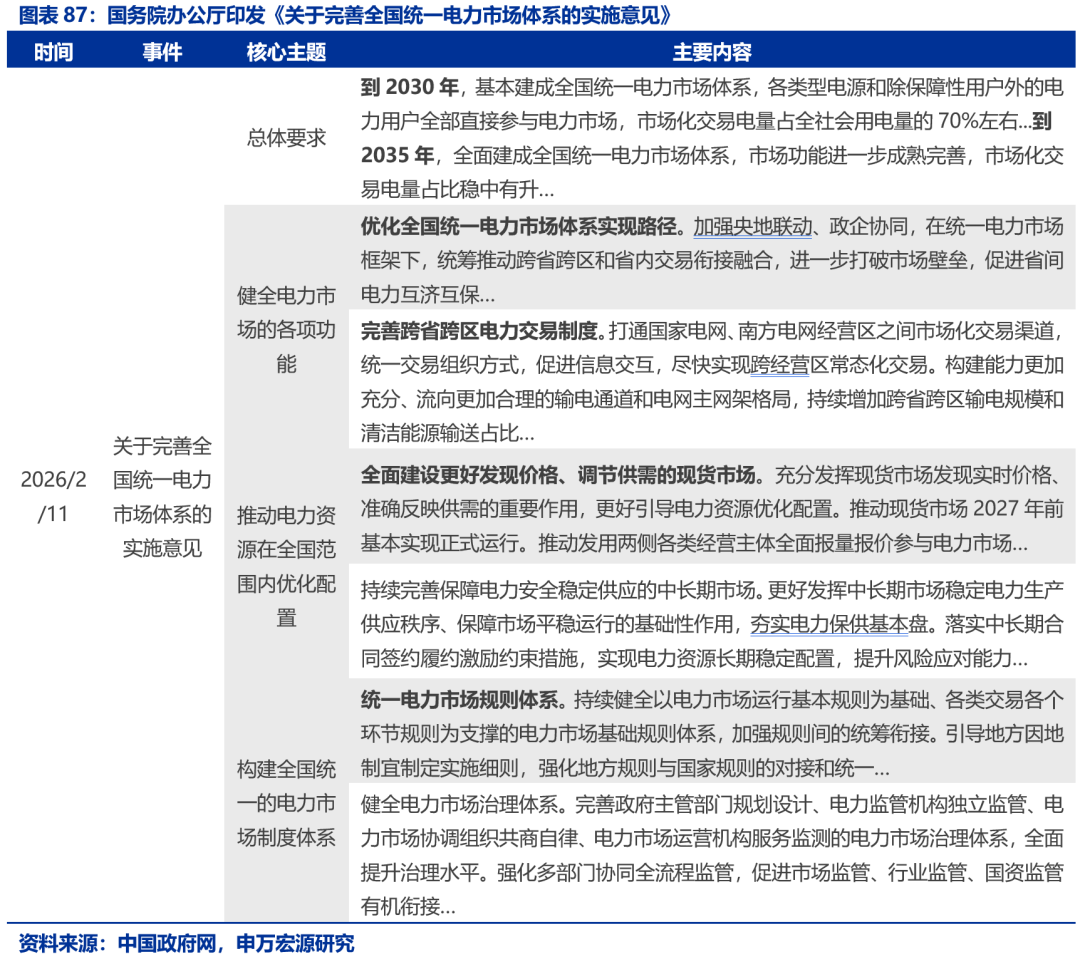
(viii) General Office of the State Council: Improve the national unified electricity market system
On February 11, the General Office of the State Council issued the "Implementation Opinions on Improving the National Unified Electricity Market System," aiming to deepen the reform of the power system and improve the relevant market and pricing mechanisms for the new energy system. The Opinions clarify that a national unified electricity market system will be basically established by 2030, with market-based electricity transactions accounting for approximately 70% of total electricity consumption. The system will be fully established by 2035. The Opinions propose to promote the optimal allocation of electricity resources nationwide, open up trading channels within power grid operating areas, promote the integration of inter-provincial and inter-regional transactions with intra-provincial transactions, improve the functions of diversified markets such as spot, medium- and long-term, ancillary services, and green electricity, construct a unified system of rules, governance, electricity prices, technical standards, and credit systems, and strengthen policy coordination and organizational leadership to provide support for energy security, economic and social development, and green and low-carbon transformation.
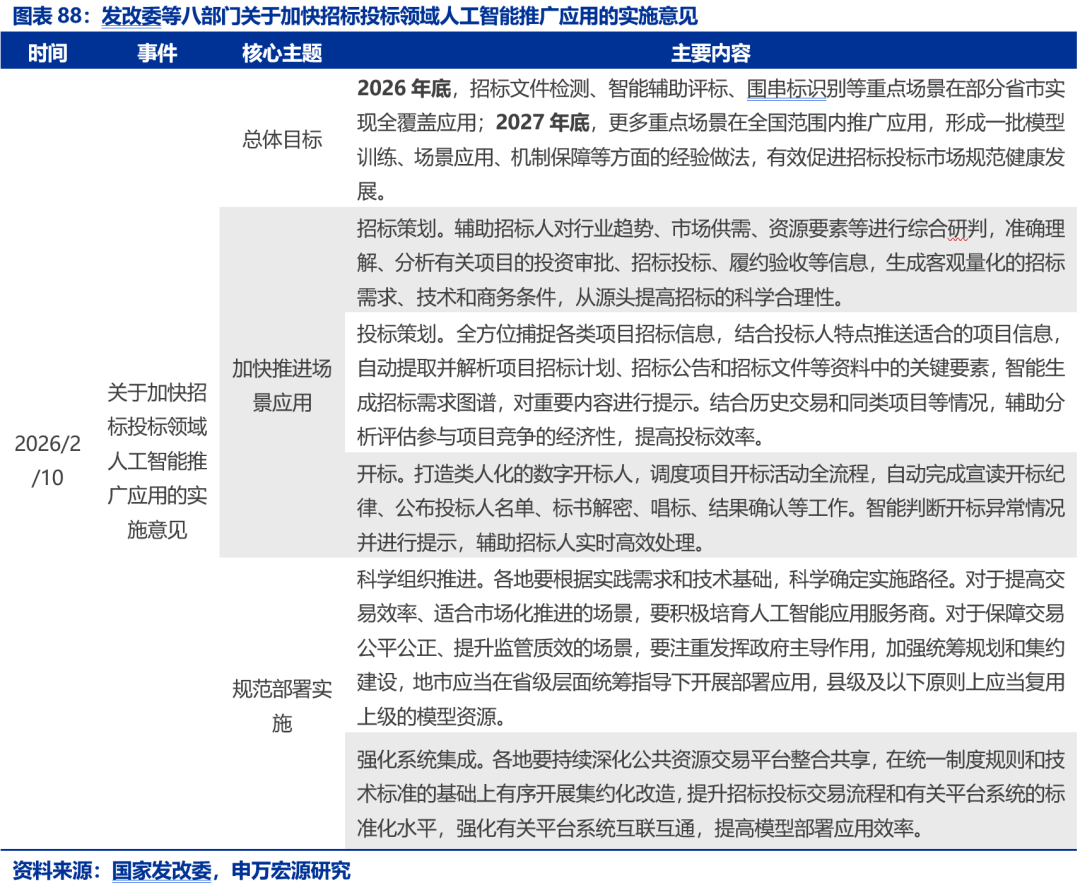
(ix) National Development and Reform Commission, etc.: Accelerate the promotion and application of artificial intelligence in the field of bidding and tendering.
On February 10, eight departments, including the National Development and Reform Commission, jointly issued the "Implementation Opinions on Accelerating the Promotion and Application of Artificial Intelligence in the Bidding and Tendering Field," aiming to promote the deep integration of bidding and tendering with artificial intelligence and to regulate market order. The Opinions clearly state that, following the principles of "government guidance, multi-party participation, scenario-driven approach, and safety and controllability," key scenarios such as tender document inspection, intelligent assisted bid evaluation, and collusion identification will achieve full coverage in some provinces and cities by the end of 2026, and nationwide application by the end of 2027. The Opinions deploy 20 application scenarios in six categories: bidding, tendering, bid opening and evaluation, bid awarding, on-site management, and supervision, while also clarifying implementation requirements such as scientific organization and promotion, strengthening system integration, consolidating data foundations, adhering to technology-assisted positioning, and improving security levels.
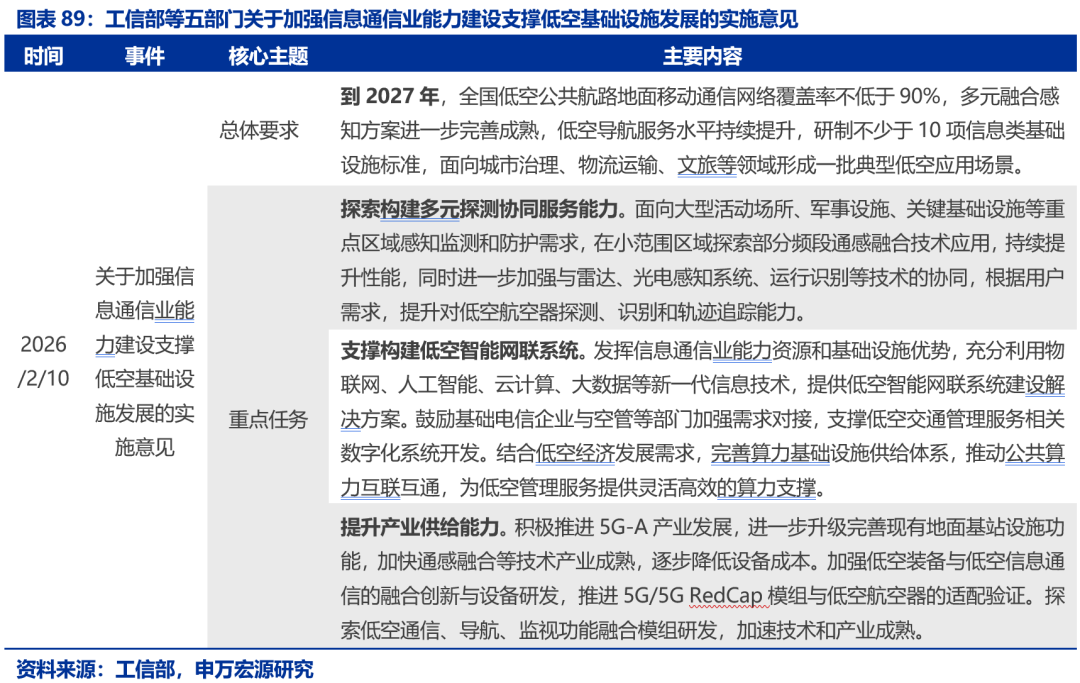
(x) Ministry of Industry and Information Technology, etc.: Strengthen the support of the information and communication industry for low-altitude infrastructure.
On February 10, five departments, including the Ministry of Industry and Information Technology, jointly issued the "Implementation Opinions on Strengthening the Capacity Building of the Information and Communication Industry to Support the Development of Low-Altitude Infrastructure." The aim is to strengthen the supporting role of the information and communication industry in low-altitude infrastructure, promote the healthy development of the low-altitude economy, and cultivate new productive forces. The opinions clearly adhere to the principles of "demand-driven, intensive and reusable, pilot-based, and safe and controllable," proposing goals such as achieving a national low-altitude public airway ground mobile communication network coverage rate of no less than 90% by 2027, developing no fewer than 10 information infrastructure standards, and forming a number of typical low-altitude application scenarios. Key deployments include advancing low-altitude communication network coverage on demand and building multi-dimensional detection and collaborative service capabilities.
On February 13, the Ministry of Industry and Information Technology (MIIT) convened a plenary meeting of the Leading Group for the Development of the Low-Altitude Industry, proposing to increase policy support for the innovative development of the low-altitude industry, accelerate standard pre-research, and establish and improve the industry standard system. The meeting stated that during the 15th Five-Year Plan period, it is crucial to fully understand the new situation facing the development of my country's low-altitude industry and steadily promote its safe, orderly, and healthy development. Efforts should be focused on strengthening the safety foundation, enhancing management of the manufacturing industry, attaching great importance to low-altitude radio safety, network security, and data security, and constructing a low-altitude equipment testing and verification system. The meeting also emphasized strengthening research on fundamental and common technologies in the industry and accelerating the application of artificial intelligence. Furthermore, it stressed the need to orderly expand application scenarios, strengthen scenario-driven equipment upgrades, deepen high-level international cooperation, and solidify the industry's talent base to provide strong support for the development of the strategic emerging industry of the low-altitude economy.
This article primarily organizes data and events, and does not involve updates to viewpoints. All comments mentioned are reiterations of viewpoints from previous reports.
Risk Warning
1. Escalation of geopolitical conflicts.The conflict between Russia and Ukraine has not yet ended, and geopolitical conflicts may exacerbate oil price volatility, disrupting the global process of "de-inflation" and the expectation of a "soft landing".
2. The US economy is slowing down more than expected.Pay attention to the risks of weakening employment and consumption in the United States.
3. The Federal Reserve turned hawkish more than expected.If US inflation shows greater resilience, it could influence the pace of future interest rate cuts by the Federal Reserve.
THE END
This article is sourced from: