


Author:Fishing expert ks
Dogecoin (DOGE) holds steady by press time on Wednesday after a nearly 4% rise on Tuesday. Derivatives data indicate a surge in bullish bets and retail interest as the broader cryptocurrency market recovers on hopes that the US Federal Reserve (Fed) will reduce interest rates by 25 basis points. The technical outlook for DOGE remains mixed, with the local resistance trendline in focus as technical indicators suggest a decline in selling pressure.
Dogecoin gains retail strength
Dogecoin is catching retail demand, suggesting a potential rebound driven by speculation. CoinGlass data shows that DOGE futures Open Interest (OI) stands at $1.49 billion, up 10.29% over the last 24 hours. This increase in the DOGE futures market suggests renewed risk-on sentiment among investors.
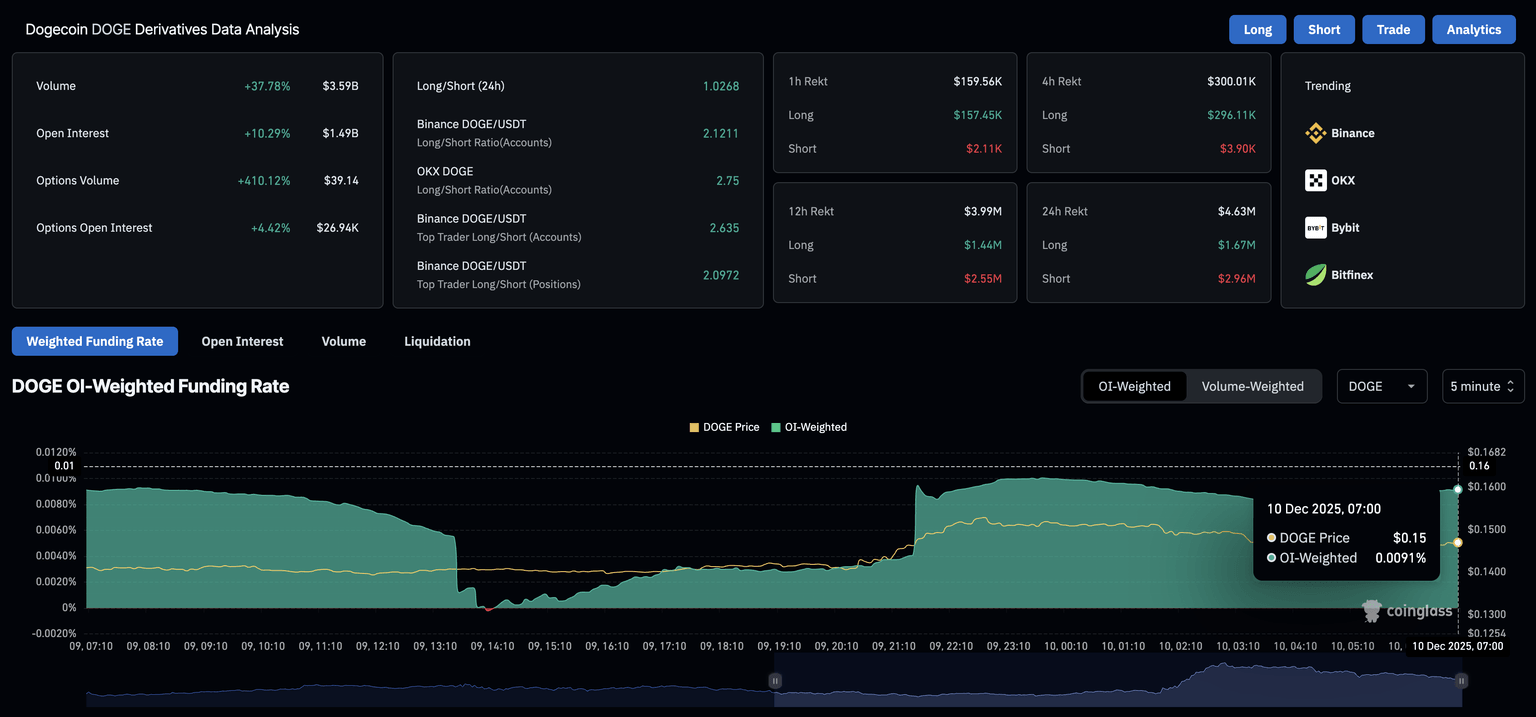
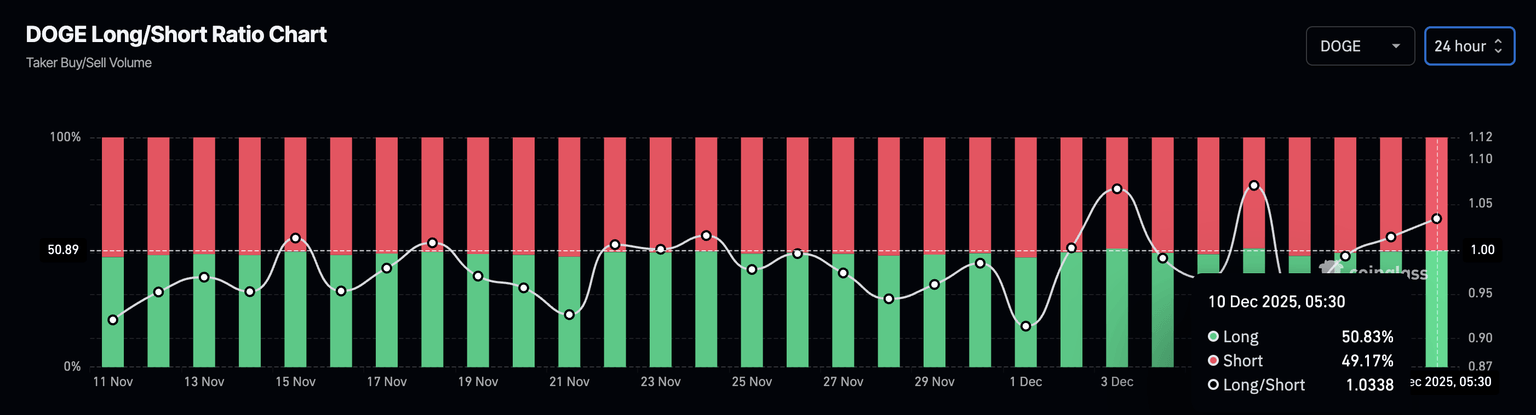
Along the same lines, the OI-weighted funding rate stands at 0.091%, reflecting a bullish bias among investors willing to pay a premium to hold long positions. Meanwhile, the long-to-short ratio chart shows that bulls hold 50.83% of all active positions, up from 48.44% on Sunday.
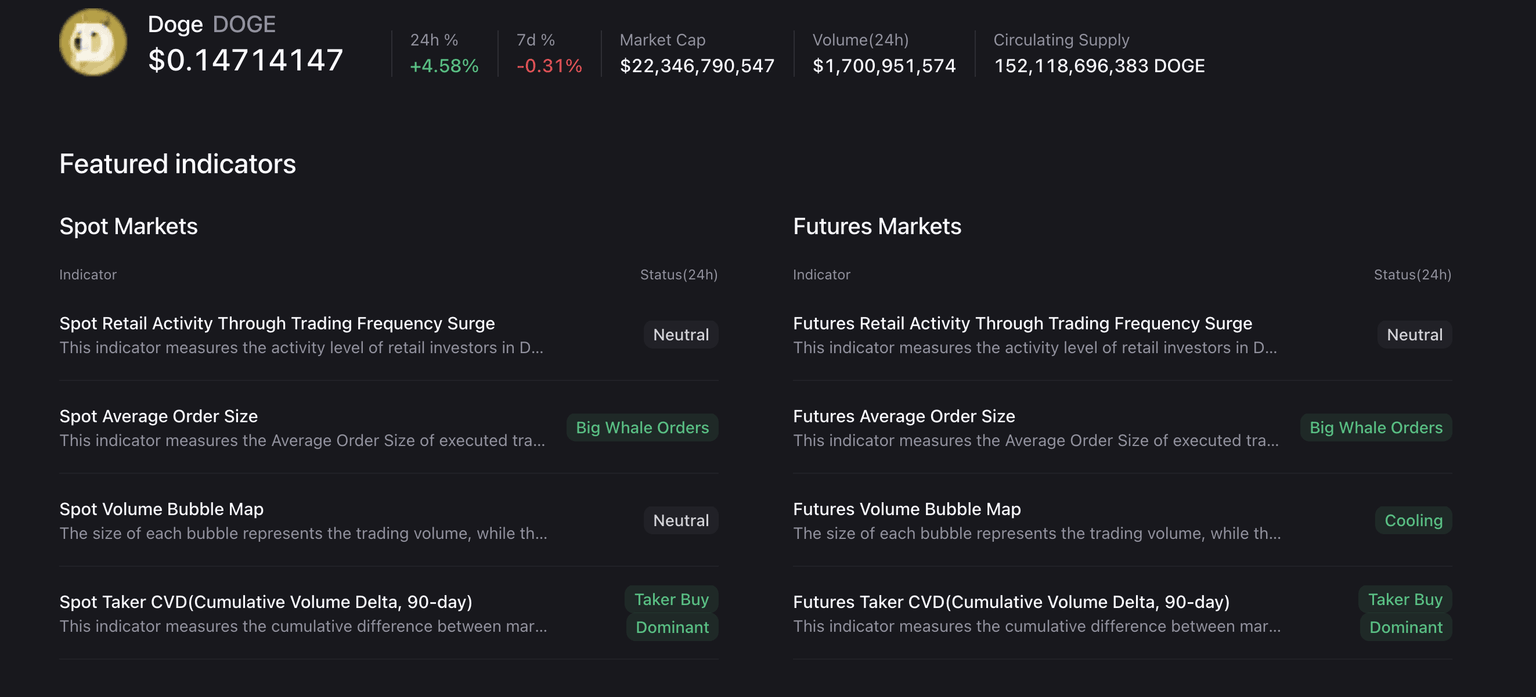
CryptoQuant data shows that increased demand for DOGE derivatives is driven by large wallet investors, commonly referred to as whales. A surge in the average order size for DOGE futures, driven by multiple high-volume orders, suggests that whales are anticipating further recovery in the meme coin.
Dogecoin eyes resistance trendline breakout to extend gains
Dogecoin approaches the local resistance trendline formed by connecting the October 26 and November 11 highs, at $0.1480. If Dogecoin closes higher on Wednesday, it could confirm the trendline breakout and target the 50-day Exponential Moving Average (EMA) at $0.1644.
A supply zone slightly above $0.1800, marked red on the chart below, followed by the 200-day EMA at $0.1970, could serve as overhead resistance.
Still, the technical indicators on the daily chart remain near neutral. The Relative Strength Index (RSI) is at 46, maintaining a largely sideways trend between the midline and oversold zone. Meanwhile, the Moving Average Convergence Divergence (MACD) continues to rise, with its signal line approaching the zero line.
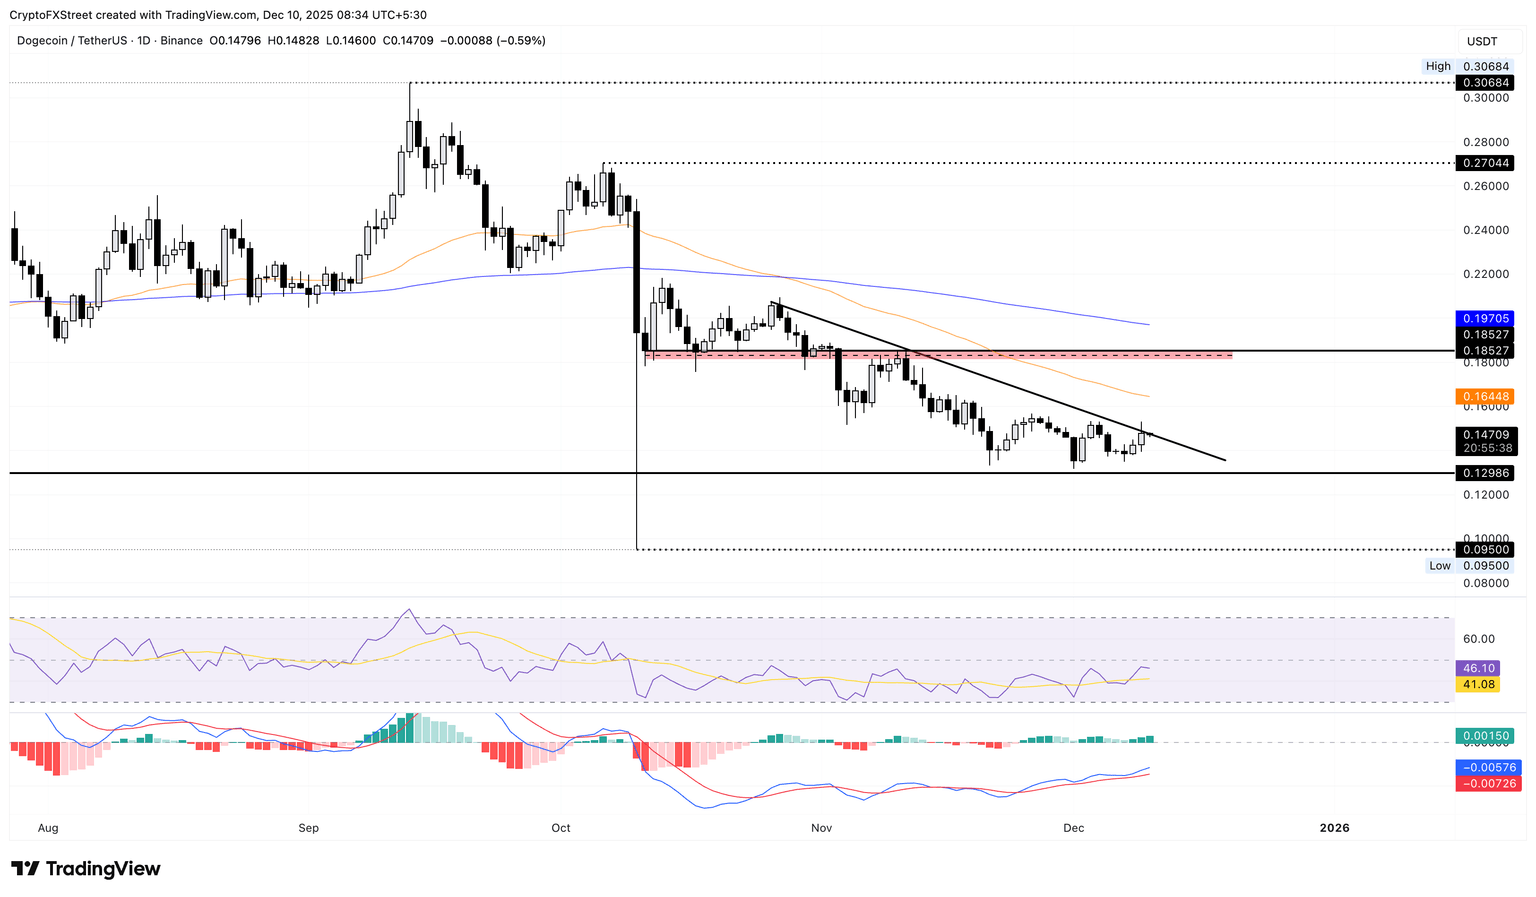
On the flip side, if DOGE falls below its April low at $0.1298, it could target the October 10 low at $0.9500.